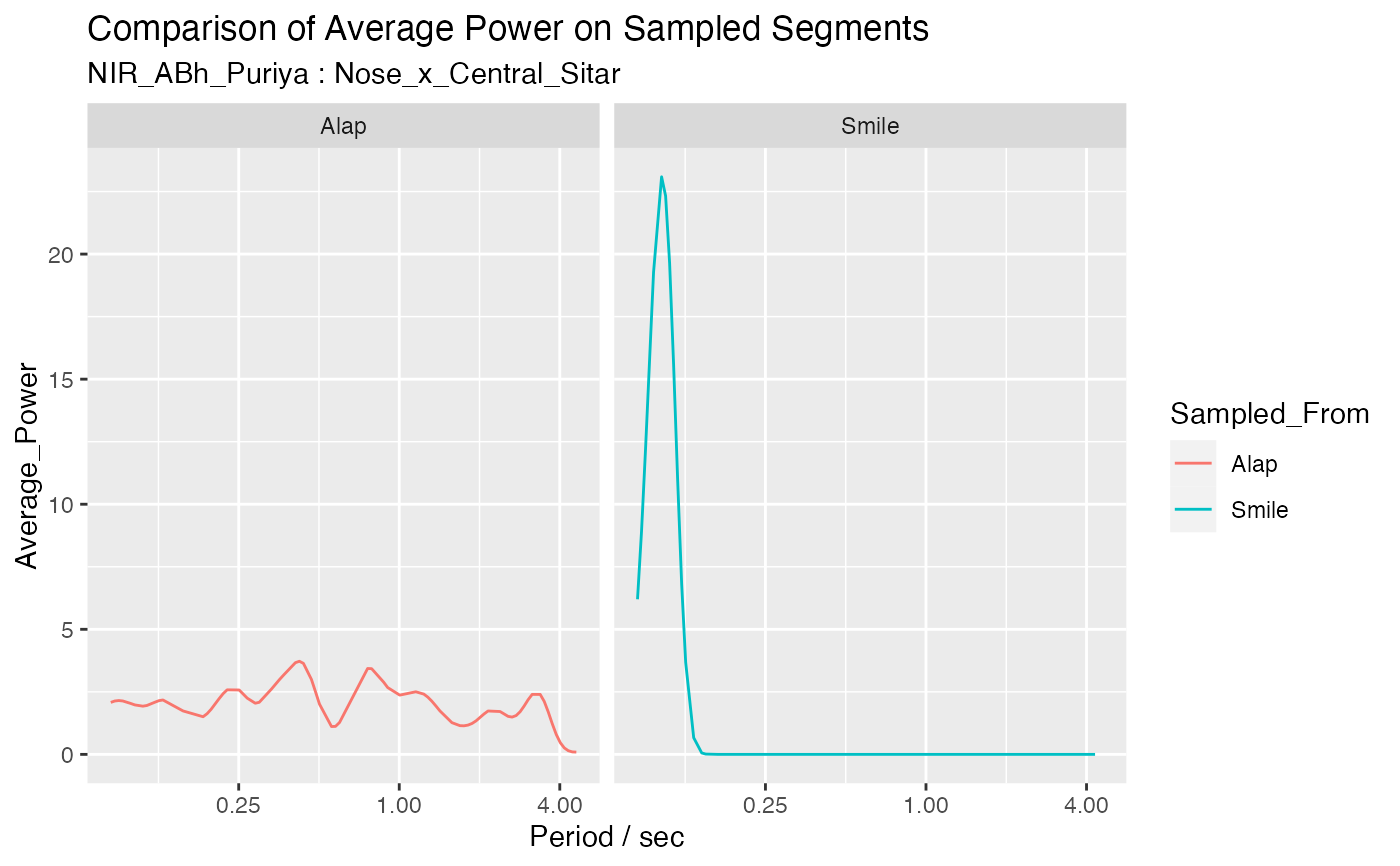
Compare the average power distribution of two SplicedViews using sampling on each segment
compare_avg_power2.RdCompare the average power distribution of two SplicedViews using sampling on each segment
Arguments
- sv1
SplicedViewobject.- sv2
SplicedViewobject.- name1
name for first object.
- name2
name for second object.
- num_samples
number of samples to draw from segments.
- column
column name in the data e.g. 'Nose_x_Central_Sitar'.
- show_plot
show the plot?
See also
Other statistical and analysis functions:
apply_column_spliceview(),
apply_segment_spliceview(),
ave_cross_power_over_splices(),
ave_cross_power_spliceview(),
ave_power_over_splices(),
ave_power_spliceview(),
calculate_ave_cross_power1(),
calculate_ave_power1(),
compare_ave_cross_power1(),
compare_ave_power1(),
compare_avg_cross_power2(),
difference_onsets(),
pull_segment_spliceview(),
sample_gap_splice(),
sample_offset_splice(),
summary_onsets(),
visualise_sample_splices()
Examples
r <- get_sample_recording()
d1 <- get_duration_annotation_data(r)
fv_list <- get_filtered_views(r, data_points = "Nose", n = 41, p = 3)
jv <- get_joined_view(fv_list)

# only one relevant section for sample data
splicing_smile_df <- splice_time(d1, tier ='INTERACTION',
  comments = 'Mutual look and smile')
sv_duration_smile <- get_spliced_view(jv, splicing_df = splicing_smile_df)

splicing_alap_df <- splice_time(
  d1, tier = 'FORM', comments = 'Alap'
)
sv_duration_alap <- get_spliced_view(jv, splicing_df = splicing_alap_df)

sample_list <- compare_avg_power2(
sv_duration_smile, sv_duration_alap, 'Smile', 'Alap', num_samples = 100,
  column = "Nose_x_Central_Sitar")
#> Starting wavelet transformation...
#> ... and simulations...
#>
  |
  |                                                                      |   0%
  |
  |======================================================================| 100%
#> Class attributes are accessible through following names:
#> series loess.span dt dj Wave Phase Ampl Power Power.avg Power.pval Power.avg.pval Ridge Period Scale nc nr coi.1 coi.2 axis.1 axis.2 date.format date.tz