Comparison plot of phases of a coherency object
plot_sel_phases.RdComparison plot of phases of a coherency object
Arguments
- obj
coherency object.
- view
View object.
- sel.period
a single number which determines the (closest available) Fourier period to be selected. Default: NULL.
- sel.upper
a number to define an upper Fourier period (or the closest available) for the selection of a band of periods (effective if sel.period is NULL). Default: NULL.
- sel.lower
a number to define a lower Fourier period (or the closest available) for the selection of a band of periods (effective if sel.period is NULL). Default: NULL.
- ...
passed to
WaveletComp::wc.sel.phases().
See also
Other wavelet functions:
analyze_coherency(),
analyze_wavelet(),
get_local_max_average_power(),
plot_average_coherency(),
plot_average_power(),
plot_cross_spectrum(),
plot_cwt_energy(),
plot_phase_difference(),
plot_power_spectrum(),
plot_roll_resultant_length(),
plot_wt_energy()
Examples
r <- get_sample_recording()
rv <- get_raw_view(r, "Central", "", "Sitar")
pv <- get_processed_view(rv)
co <- analyze_coherency(pv, columns = c("Nose_x", "Nose_y"))
#>
|
| | 0%
|
|======================================================================| 100%
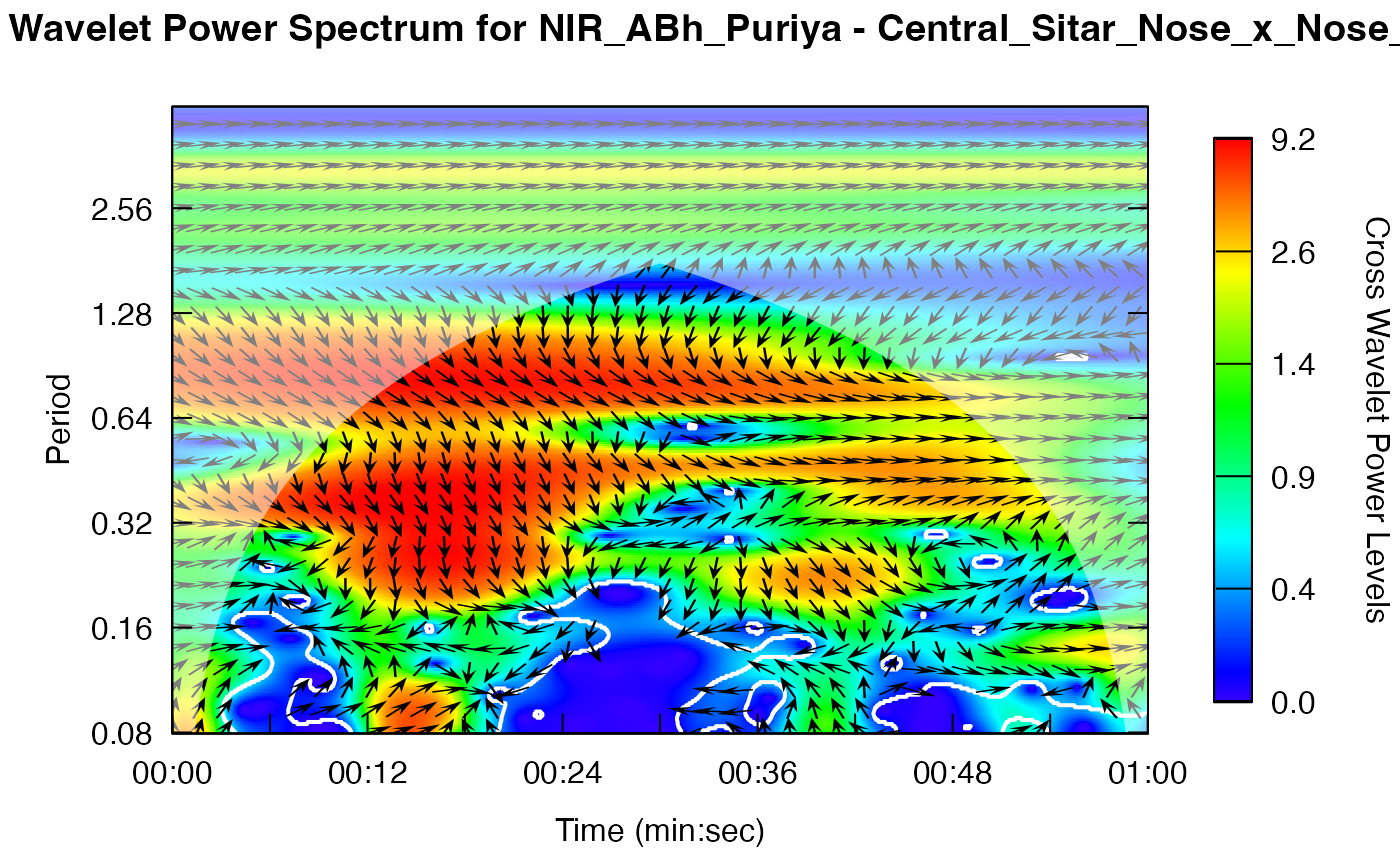
plot_cross_spectrum(co, pv)
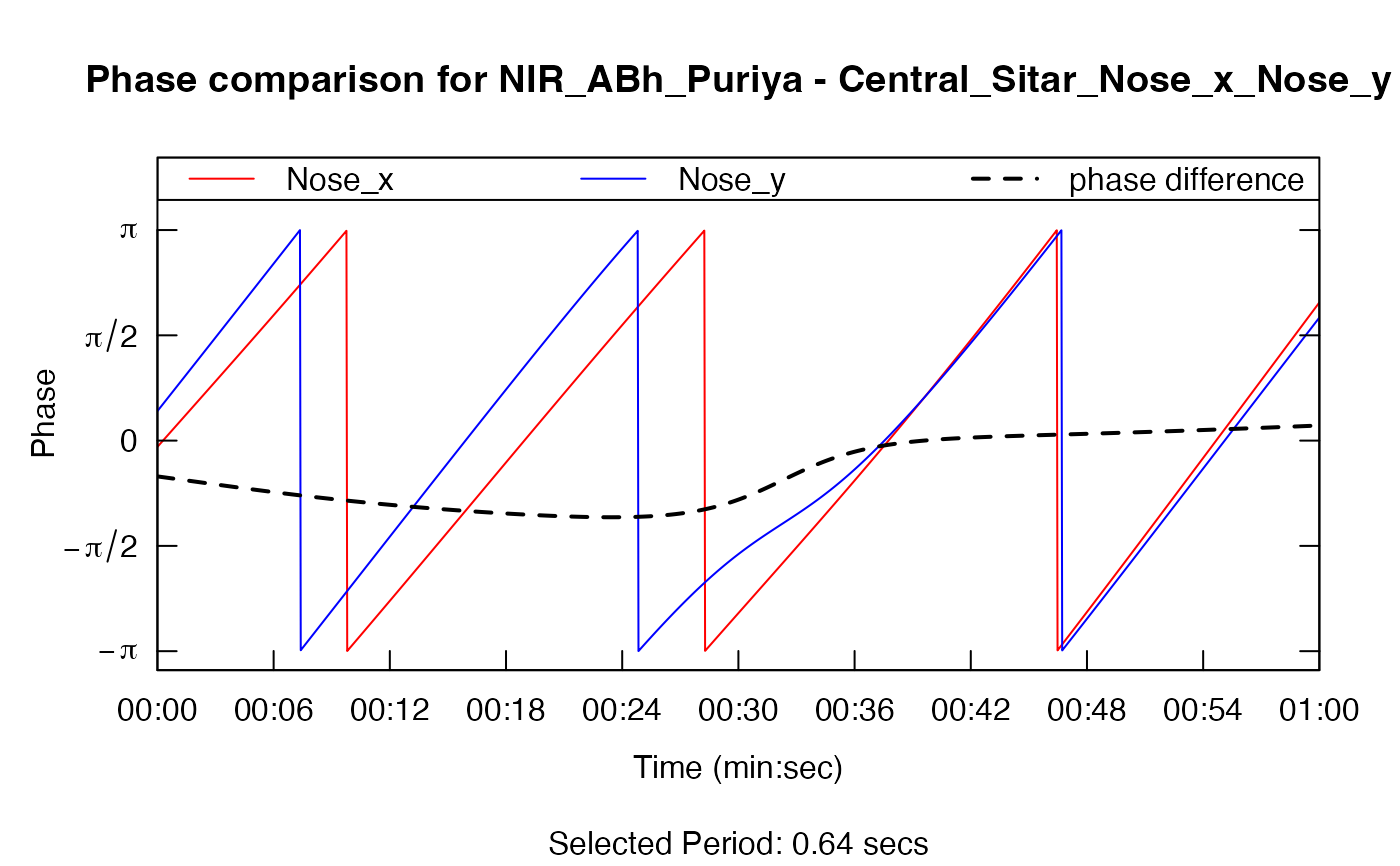
 plot_sel_phases(co, pv, sel.period = 0.64)
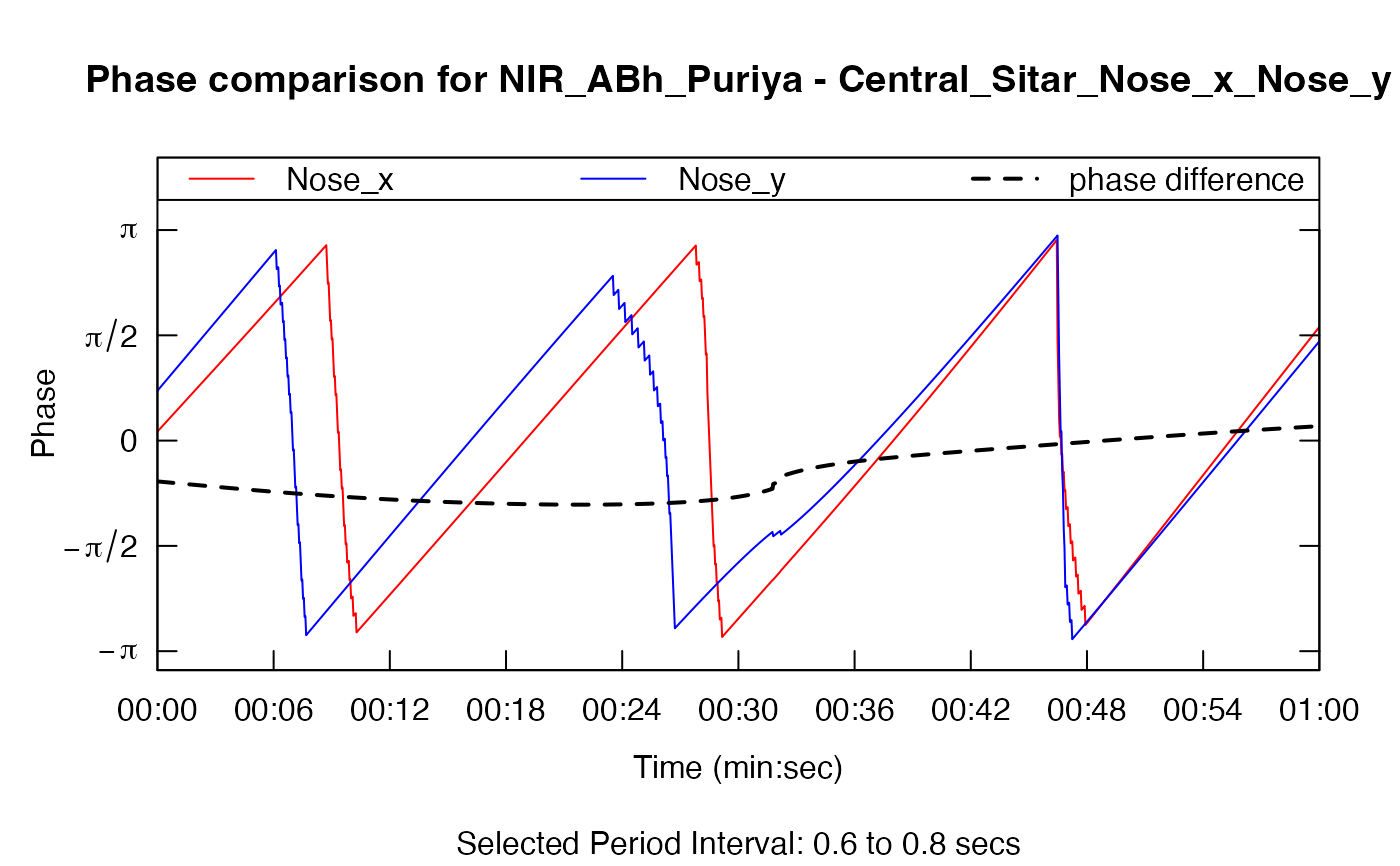
 plot_sel_phases(co, pv, sel.lower = 0.6, sel.upper = 0.8)