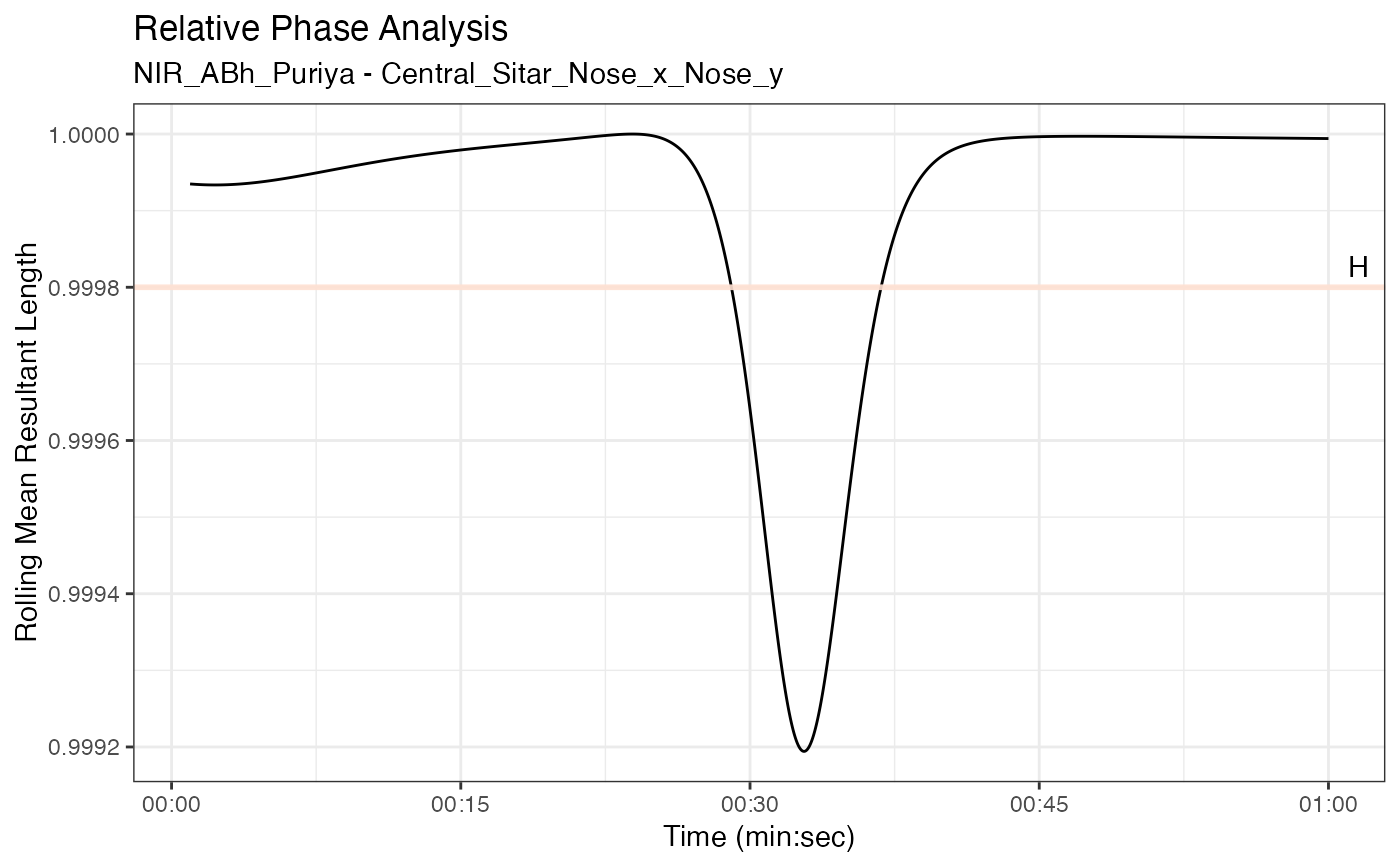
Plot windowed resultant length
plot_roll_resultant_length.RdPlot windowed resultant length
Usage
plot_roll_resultant_length(
  obj,
  window_duration = 1,
  smooth = FALSE,
  by = 1,
  ref_lines = c(W = 0.7, M = 0.85, H = 0.95),
  align = "right",
  na.rm = TRUE
)
Arguments
- obj
a
sel.phasesobject.- window_duration
duration of window over which to take mean (default is 1 sec).
- smooth
use the smoothed phase angle data (default is FALSE).
- by
calculate resultant length at every
by-th time point rather than every point.- ref_lines
names list of reference line values (default is
c(W = 0.7, M = 0.85, H = 0.95)).- align
alignment of window (default is 'right').
- na.rm
Remove NAs from the circular mean (default is TRUE).
See also
Other wavelet functions:
analyze_coherency(),
analyze_wavelet(),
get_local_max_average_power(),
plot_average_coherency(),
plot_average_power(),
plot_cross_spectrum(),
plot_cwt_energy(),
plot_phase_difference(),
plot_power_spectrum(),
plot_sel_phases(),
plot_wt_energy()
Examples
r <- get_sample_recording()
rv <- get_raw_view(r, "Central", "", "Sitar")
pv <- get_processed_view(rv)
co <- analyze_coherency(pv, columns = c("Nose_x", "Nose_y"))
#>
|
| | 0%
|
|======================================================================| 100%
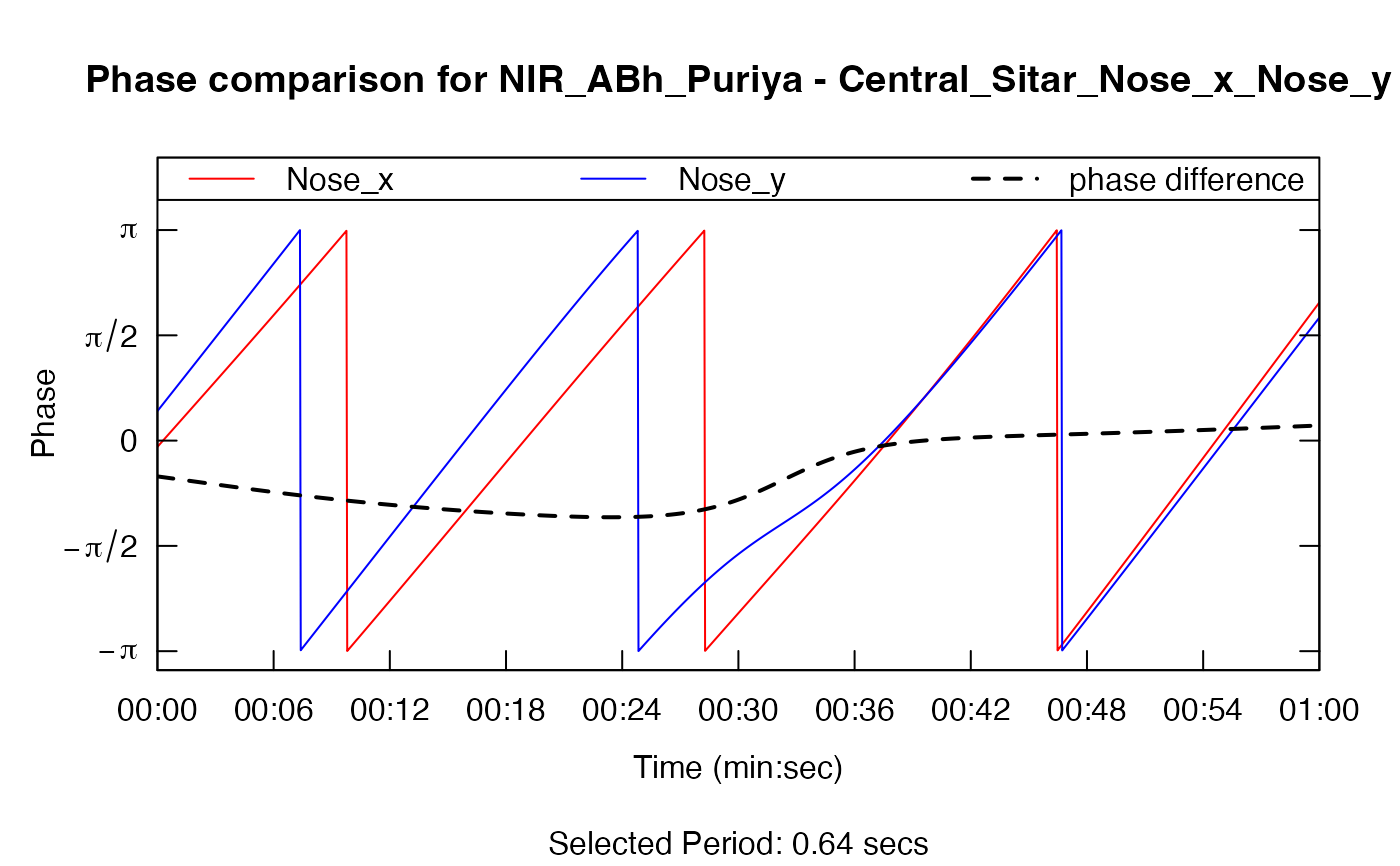
sp <- plot_sel_phases(co, pv, sel.period = 0.64)
 plot_roll_resultant_length(sp, ref_lines = c(H = 0.9998))