Plot a coherency of a wavelet object
plot_cross_spectrum.RdPlot a coherency of a wavelet object
Arguments
- obj
analyze.coherency object.
- view
View object.
- ...
passed to
WaveletComp::wc.image().
See also
Other wavelet functions:
analyze_coherency(),
analyze_wavelet(),
get_local_max_average_power(),
plot_average_coherency(),
plot_average_power(),
plot_cwt_energy(),
plot_phase_difference(),
plot_power_spectrum(),
plot_roll_resultant_length(),
plot_sel_phases(),
plot_wt_energy()
Examples
r <- get_sample_recording()
rv <- get_raw_view(r, "Central", "", "Sitar")
pv <- get_processed_view(rv)
pv1 <- subset(pv, Time >= 10)
co <- analyze_coherency(pv1, c("Nose_x", "Nose_y"))
#>
|
| | 0%
|
|======================================================================| 100%
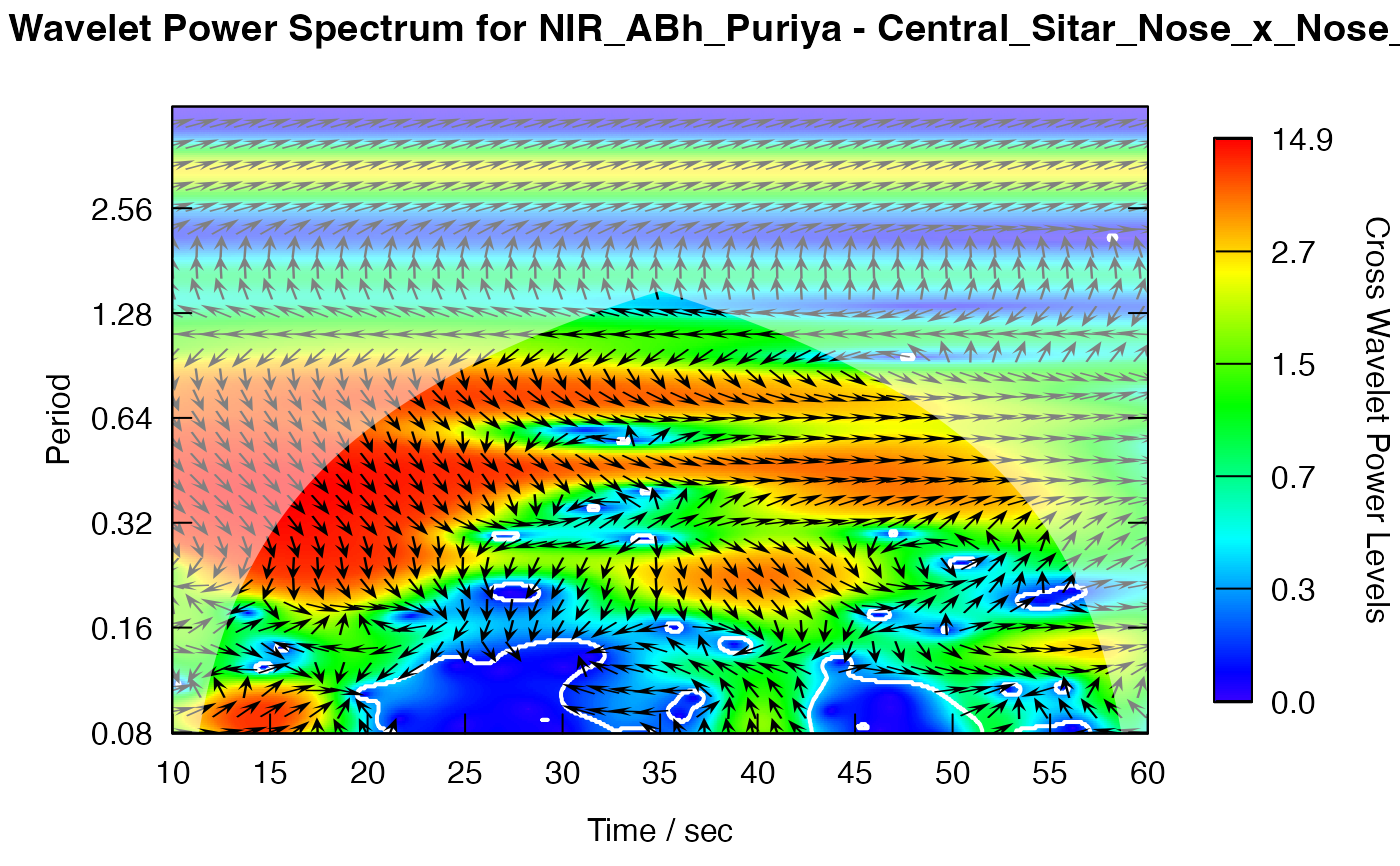
plot_cross_spectrum(co, pv1)
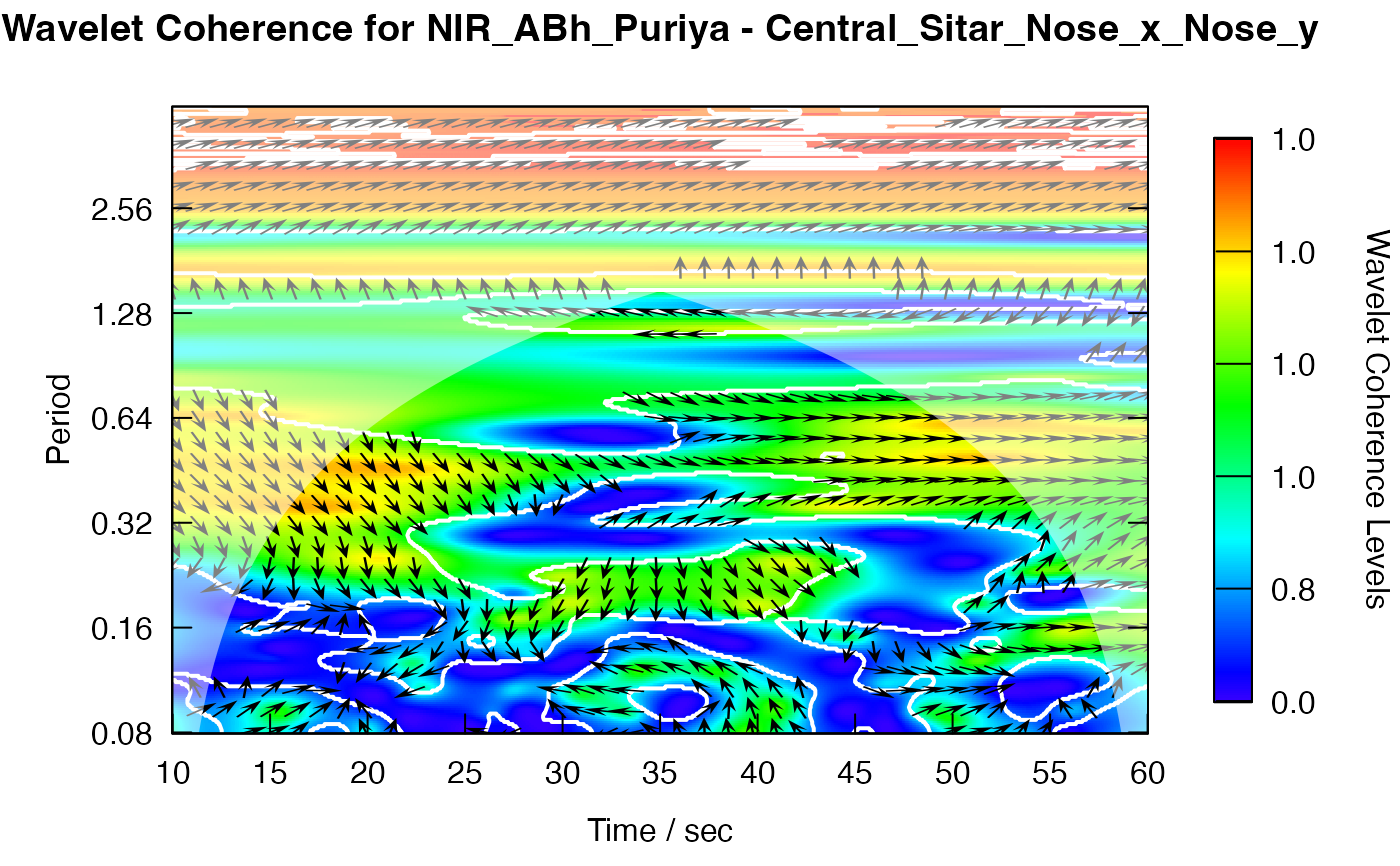
 plot_coherence(co, pv1)
#> Warning: ... your maximum level of coherency is (slightly) larger than the theoretical maximum of 1, namely: 1.00000000000579; this may be due to your smoothing specification. Values larger than 1 are set back to 1.
plot_coherence(co, pv1)
#> Warning: ... your maximum level of coherency is (slightly) larger than the theoretical maximum of 1, namely: 1.00000000000579; this may be due to your smoothing specification. Values larger than 1 are set back to 1.