Autolayer methods
autolayer.RdLayers of annotation data to add to ggplots in `movementsync.
Usage
# S3 method for OnsetsSelected
autolayer(
  object,
  time_limits = c(-Inf, Inf),
  colour = "Inst.Name",
  fill = "Metre",
  alpha = 0.4,
  instrument_cols = NULL,
  ...
)

# S3 method for Metre
autolayer(
  object,
  time_limits = c(-Inf, Inf),
  colour = "hotpink",
  alpha = 0.5,
  tempo = FALSE,
  view = NULL,
  columns = NULL,
  ...
)

# S3 method for Duration
autolayer(
  object,
  time_limits = c(-Inf, Inf),
  expr = .data$Tier == "FORM",
  fill_column = "Comments",
  geom = "rect",
  vline_column = "In",
  ...
)

# S3 method for Splice
autolayer(object, geom = "rect", vline_column = "Start", ...)
Arguments
- object
S3 object
- time_limits
tuple of time limits.
- colour
name of column for colouring.
- fill
name of column for filling.
- alpha
aesthetic
- instrument_cols
instrument column names.
- ...
passed to geom.
- tempo
do we plot tempo with a Metre layer? (Default is FALSE).
- view
view object for a tempo Metre layer (Default is NULL).
- columns
columns for view for a tempo Metre layer (Default is NULL).
- expr
unquoted R expression for filtering data (default is Tier =='FORM').
- fill_column
data column used for fill.
- geom
'rect' or 'vline'.
- vline_column
column name for position of vertical lines.
Examples
# \donttest{
r<-get_recording("NIR_ABh_Puriya", fps=25)
o <- get_onsets_selected_data(r)
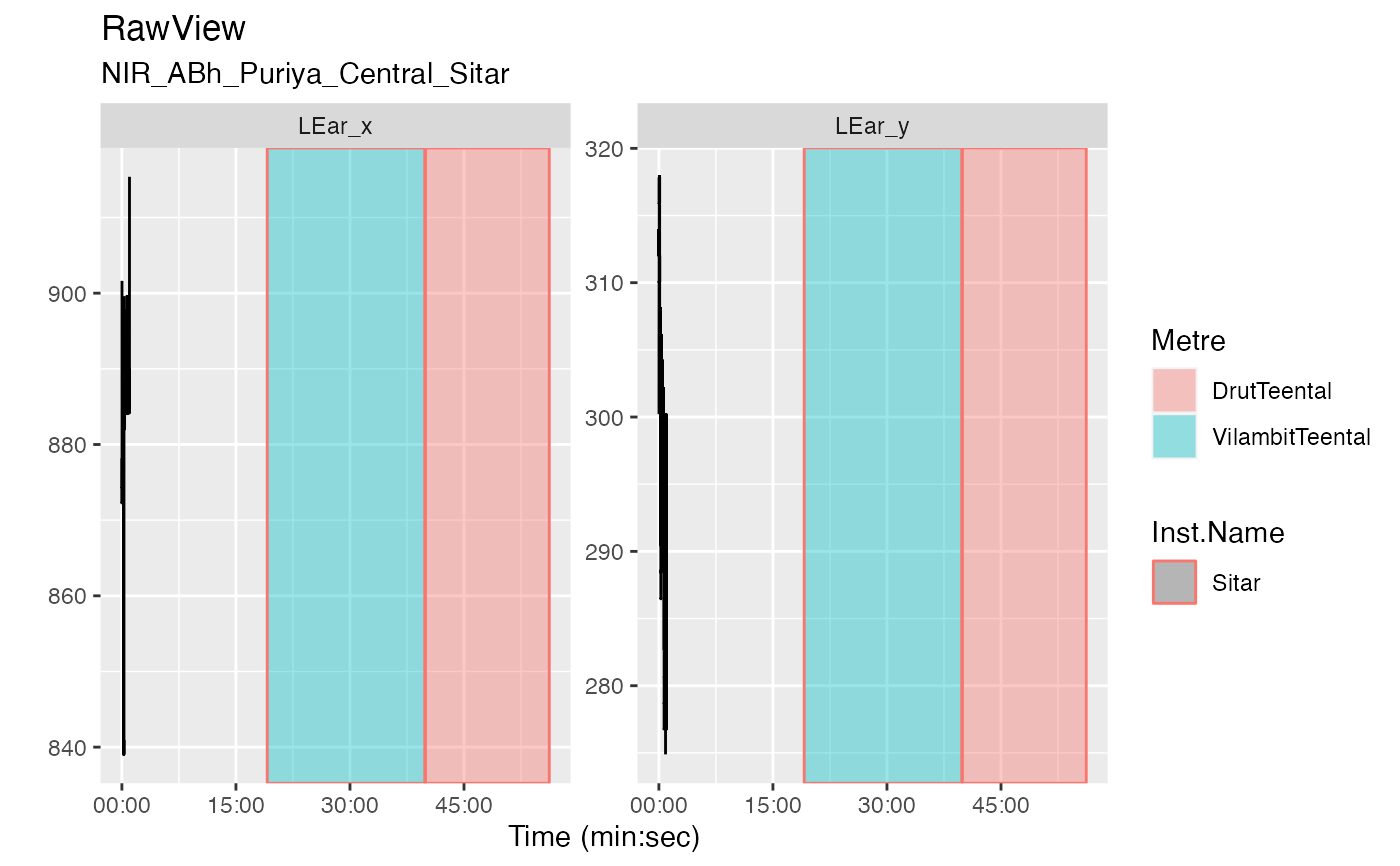
v <- get_raw_view(r, "Central", "", "Sitar")
autoplot(v, columns = c("LEar_x", "LEar_y"), maxpts=5000) + autolayer(o)
#> Warning: Removed 18 rows containing missing values (`geom_line()`).
 m <- get_metre_data(r)
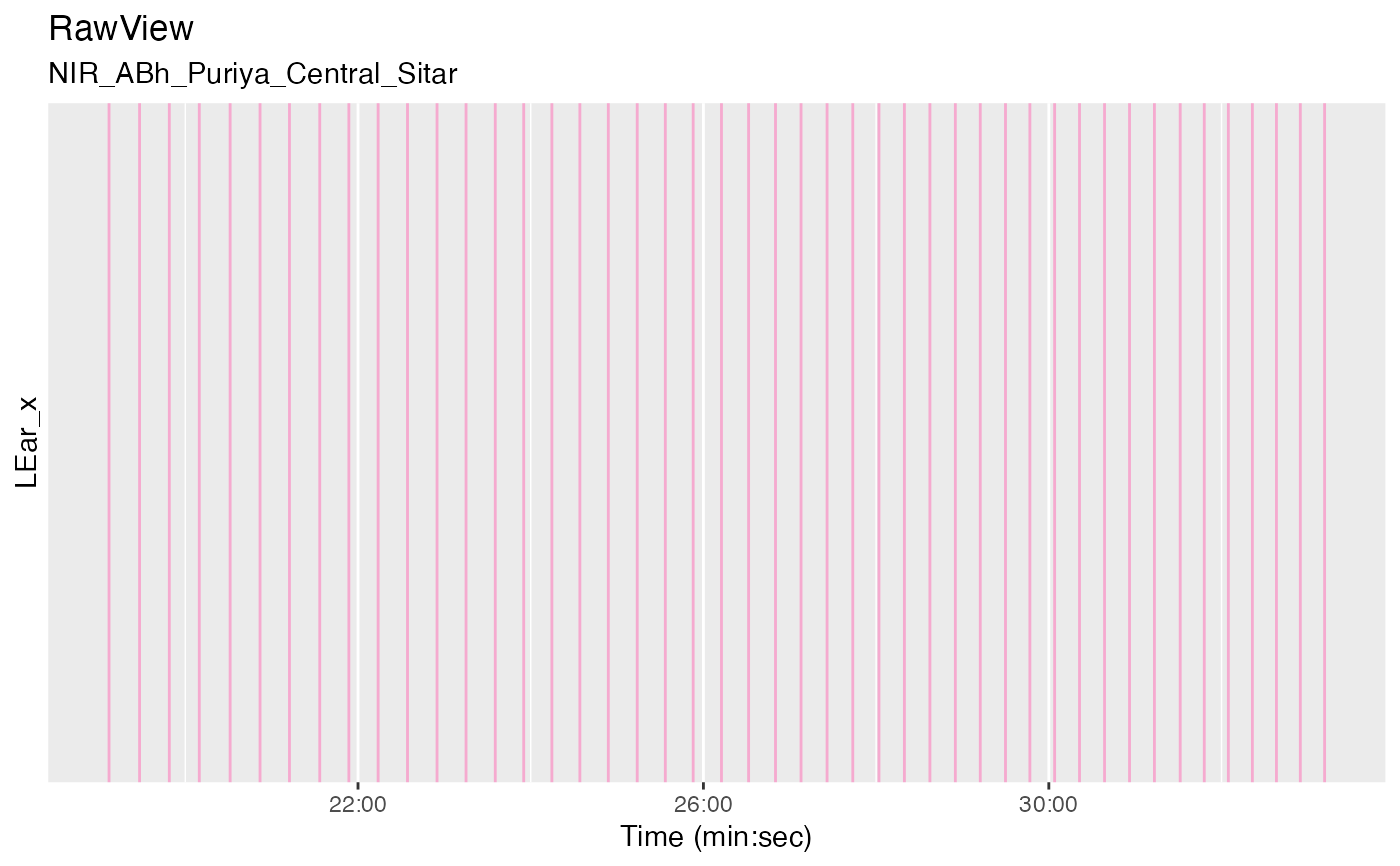
autoplot(v, columns = c("LEar_x", "LEar_y"), time_limits = c(1000, 2000)) +
autolayer(m, time_limits = c(1000, 2000))
#> Warning: Sampling rows for plotting
#> Warning: setting this dimension may lead to an invalid zoo object
#> Warning: Removed 377 rows containing missing values (`geom_vline()`).
m <- get_metre_data(r)
autoplot(v, columns = c("LEar_x", "LEar_y"), time_limits = c(1000, 2000)) +
autolayer(m, time_limits = c(1000, 2000))
#> Warning: Sampling rows for plotting
#> Warning: setting this dimension may lead to an invalid zoo object
#> Warning: Removed 377 rows containing missing values (`geom_vline()`).
 autoplot(v, columns = c("LEar_x", "LEar_y"), time_limits = c(1000, 2000)) +
autolayer(m, tempo = TRUE, time_limits = c(1000, 2000), view = v,
columns = c("LEar_x", "LEar_y"))
#> Warning: Sampling rows for plotting
#> Warning: setting this dimension may lead to an invalid zoo object
autoplot(v, columns = c("LEar_x", "LEar_y"), time_limits = c(1000, 2000)) +
autolayer(m, tempo = TRUE, time_limits = c(1000, 2000), view = v,
columns = c("LEar_x", "LEar_y"))
#> Warning: Sampling rows for plotting
#> Warning: setting this dimension may lead to an invalid zoo object
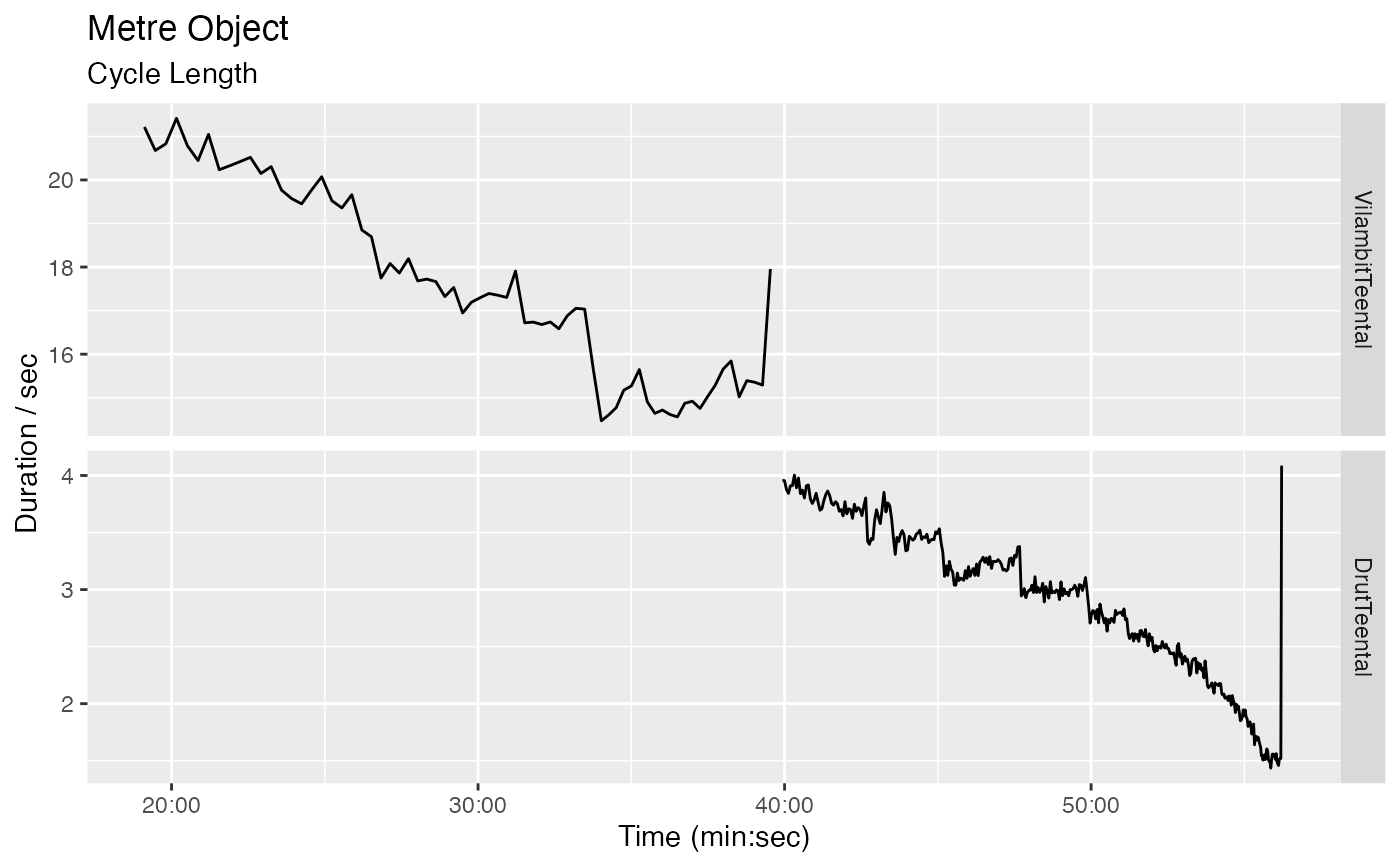
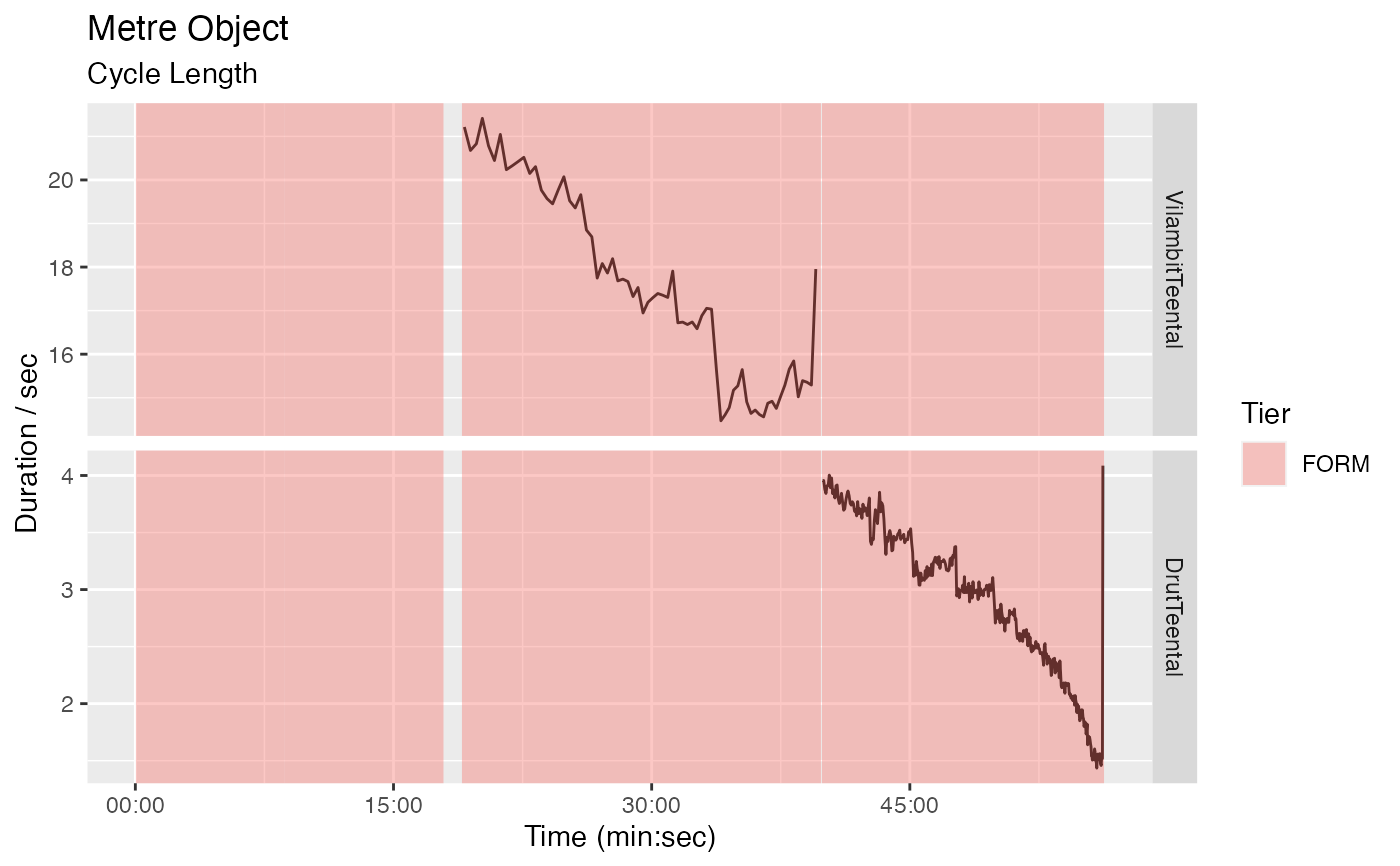
 d <- get_duration_annotation_data(r)
autoplot(m)
#> Warning: Removed 1 row containing missing values (`geom_line()`).
d <- get_duration_annotation_data(r)
autoplot(m)
#> Warning: Removed 1 row containing missing values (`geom_line()`).
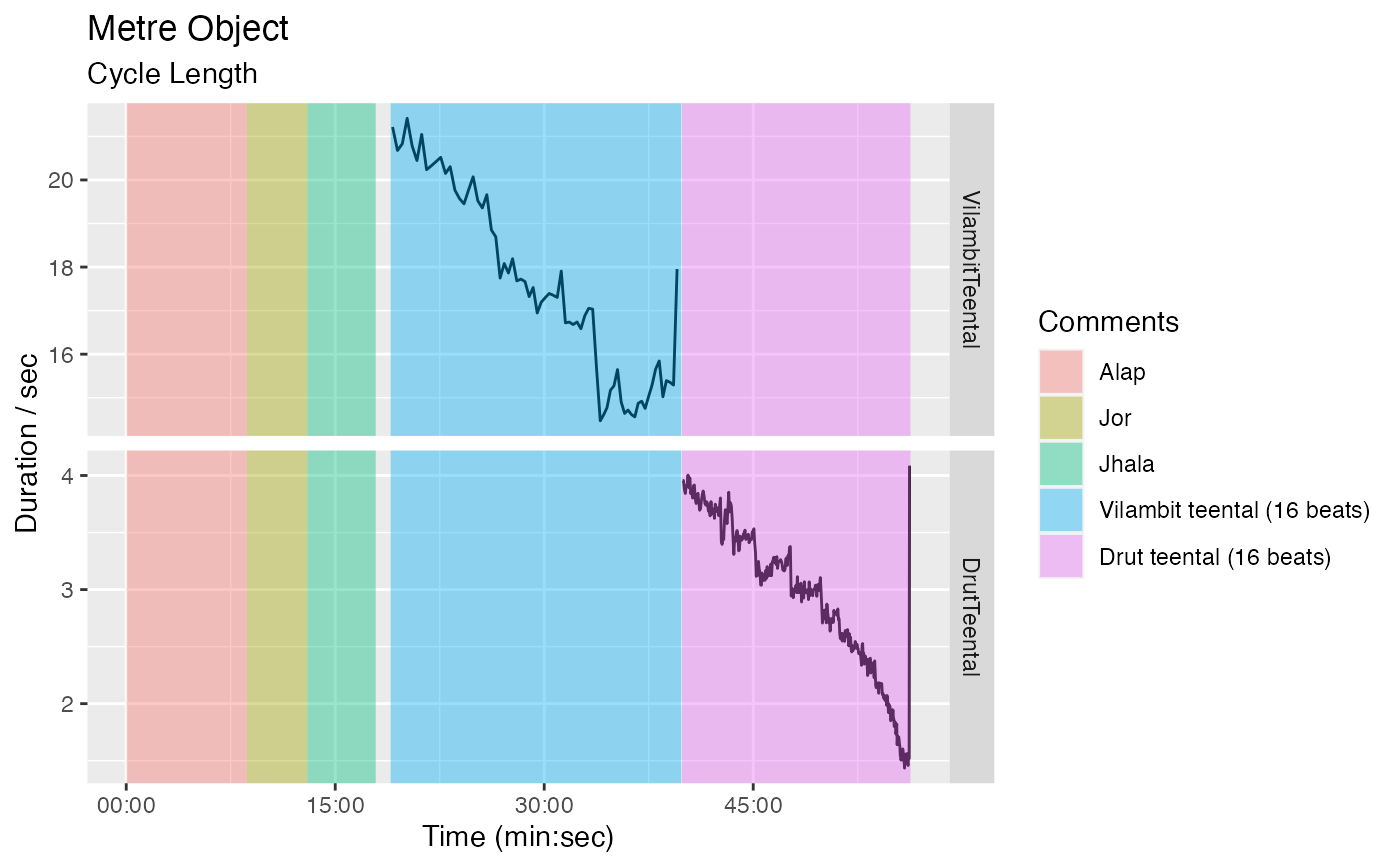
 autoplot(m) + autolayer(d)
#> Warning: Removed 1 row containing missing values (`geom_line()`).
autoplot(m) + autolayer(d)
#> Warning: Removed 1 row containing missing values (`geom_line()`).
 autoplot(m) + autolayer(d, fill_col = "Tier")
#> Warning: Removed 1 row containing missing values (`geom_line()`).
autoplot(m) + autolayer(d, fill_col = "Tier")
#> Warning: Removed 1 row containing missing values (`geom_line()`).
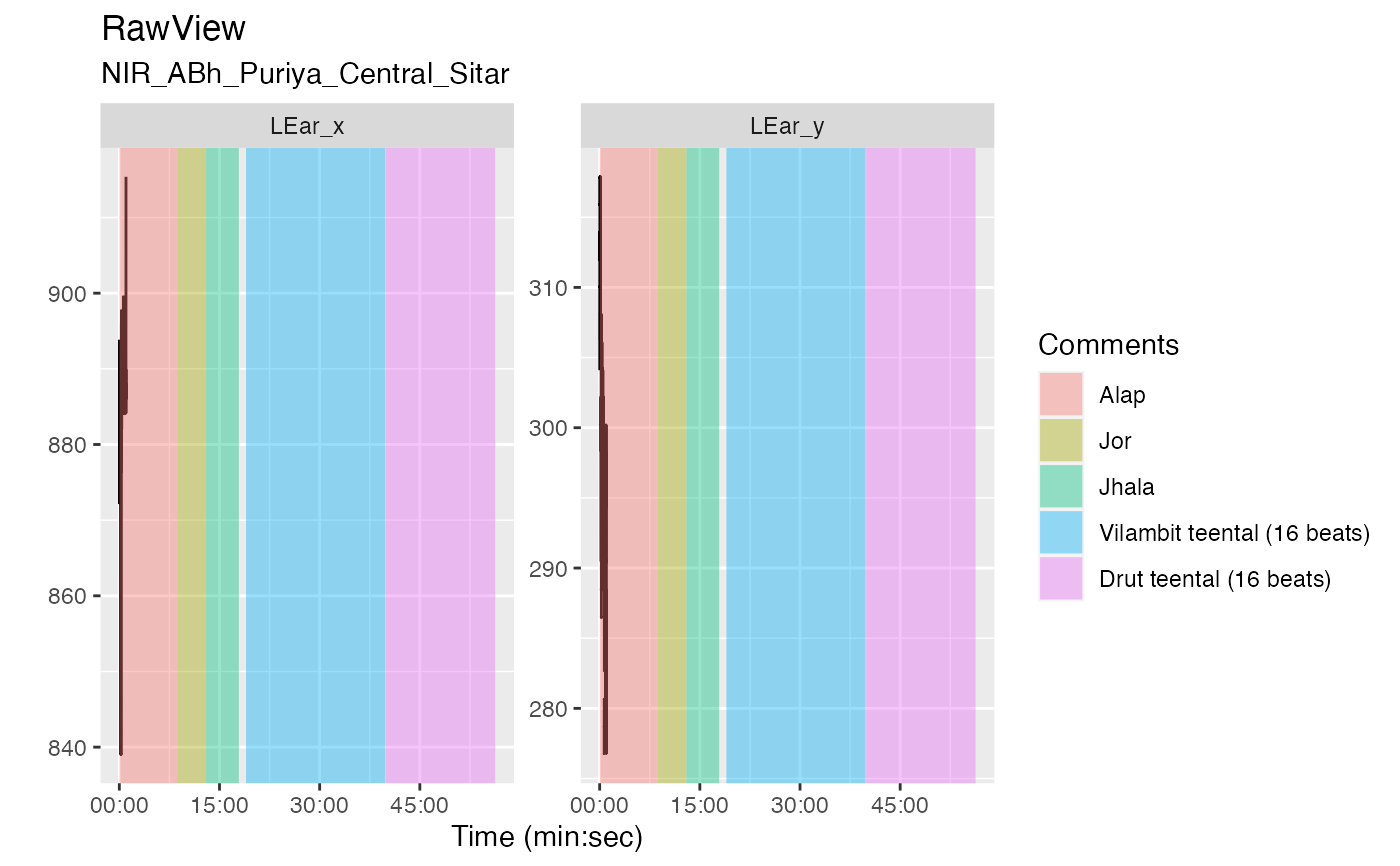
 v <- get_raw_view(r, "Central", "", "Sitar")
autoplot(v, columns = c("LEar_x", "LEar_y")) +
autolayer(d)
#> Warning: Sampling rows for plotting
#> Warning: Removed 12 rows containing missing values (`geom_line()`).
v <- get_raw_view(r, "Central", "", "Sitar")
autoplot(v, columns = c("LEar_x", "LEar_y")) +
autolayer(d)
#> Warning: Sampling rows for plotting
#> Warning: Removed 12 rows containing missing values (`geom_line()`).
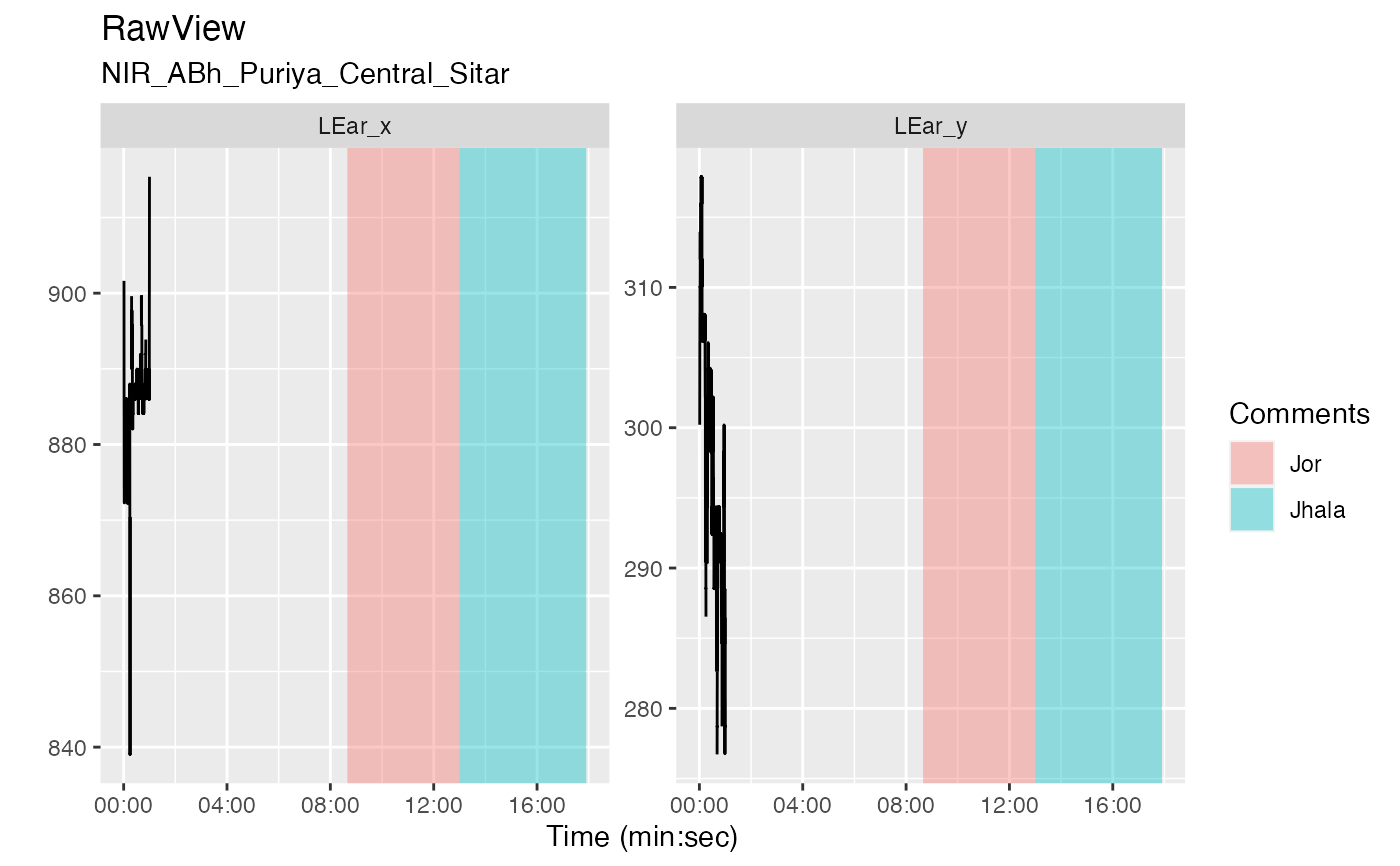
 autoplot(v, columns = c("LEar_x", "LEar_y")) +
autolayer(d, expr = Tier == "FORM" & substr(Comments, 1, 1) == "J")
#> Warning: Sampling rows for plotting
#> Warning: Removed 12 rows containing missing values (`geom_line()`).
autoplot(v, columns = c("LEar_x", "LEar_y")) +
autolayer(d, expr = Tier == "FORM" & substr(Comments, 1, 1) == "J")
#> Warning: Sampling rows for plotting
#> Warning: Removed 12 rows containing missing values (`geom_line()`).
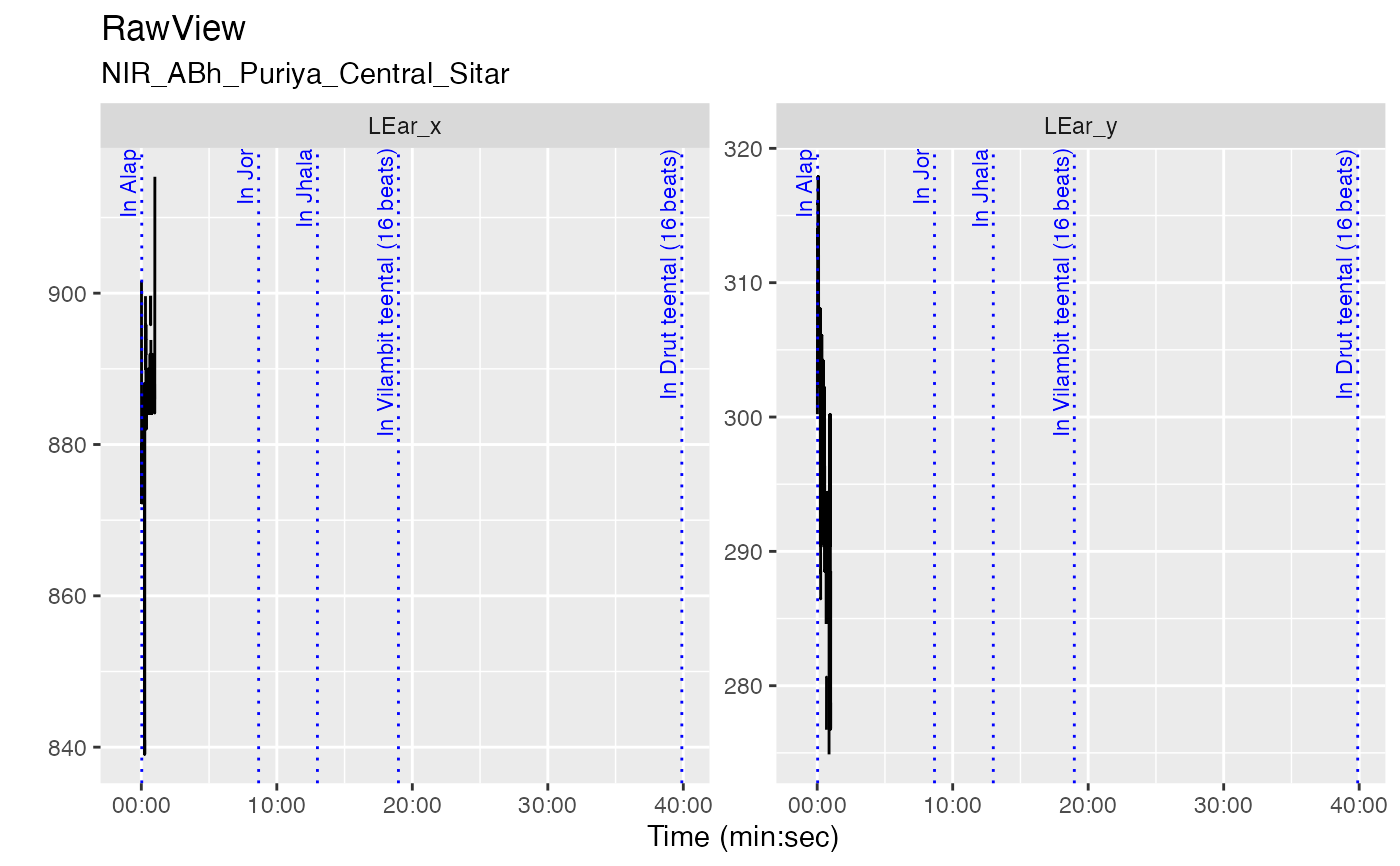
 autoplot(v, columns = c("LEar_x", "LEar_y")) +
autolayer(d, geom = "vline", nudge_x = -60, size = 3, colour = "blue")
#> Warning: Sampling rows for plotting
#> Warning: Removed 10 rows containing missing values (`geom_line()`).
autoplot(v, columns = c("LEar_x", "LEar_y")) +
autolayer(d, geom = "vline", nudge_x = -60, size = 3, colour = "blue")
#> Warning: Sampling rows for plotting
#> Warning: Removed 10 rows containing missing values (`geom_line()`).
 # }
# }