Diagnostic plots
autoplot.RdAutoplot methods for S3 objects in the movementsync package.
Usage
# S3 method for Duration
autoplot(object, horizontal = FALSE, ...)

# S3 method for OnsetsSelected
autoplot(object, instrument = "Inst", tactus = "Matra", ...)

# S3 method for Metre
autoplot(object, ...)

# S3 method for View
autoplot(
  object,
  columns = NULL,
  maxpts = 1000,
  time_limits = c(-Inf, Inf),
  time_breaks = NULL,
  expr = NULL,
  ...
)

# S3 method for SplicedView
autoplot(
  object,
  columns = NULL,
  segments = NULL,
  time_breaks = NULL,
  time_limits = c(-Inf, Inf),
  maxpts = 1000,
  ...
)
Arguments
- object
S3 object
- horizontal
make the barchart horizontal? (Default is FALSE).
- ...
passed to
zoo::plot.zoo().- instrument
instrument column name.
- tactus
beat column name.
- columns
names of columns in input data.
- maxpts
maximum number of points to plot
- time_limits
tuple to restrict the timeline or a duration object.
- time_breaks
suggests the number of major time tick marks (Default is NULL).
- expr
an R expression that sets the time scale using a duration object (Default is NULL).
- segments
only include these segments in a SplicedView plot.
Examples
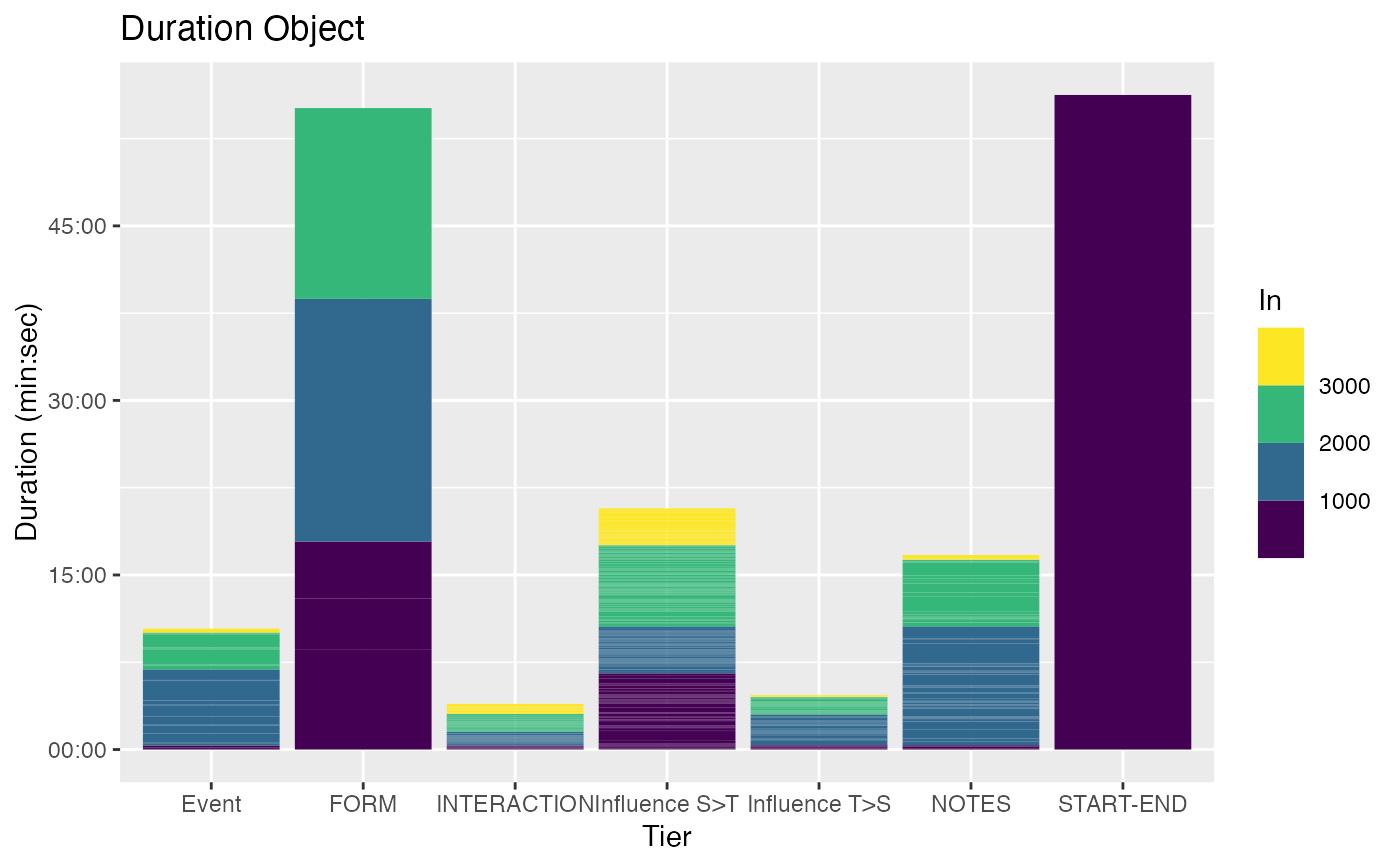
r <- get_sample_recording()
d <- get_duration_annotation_data(r)
autoplot(d)
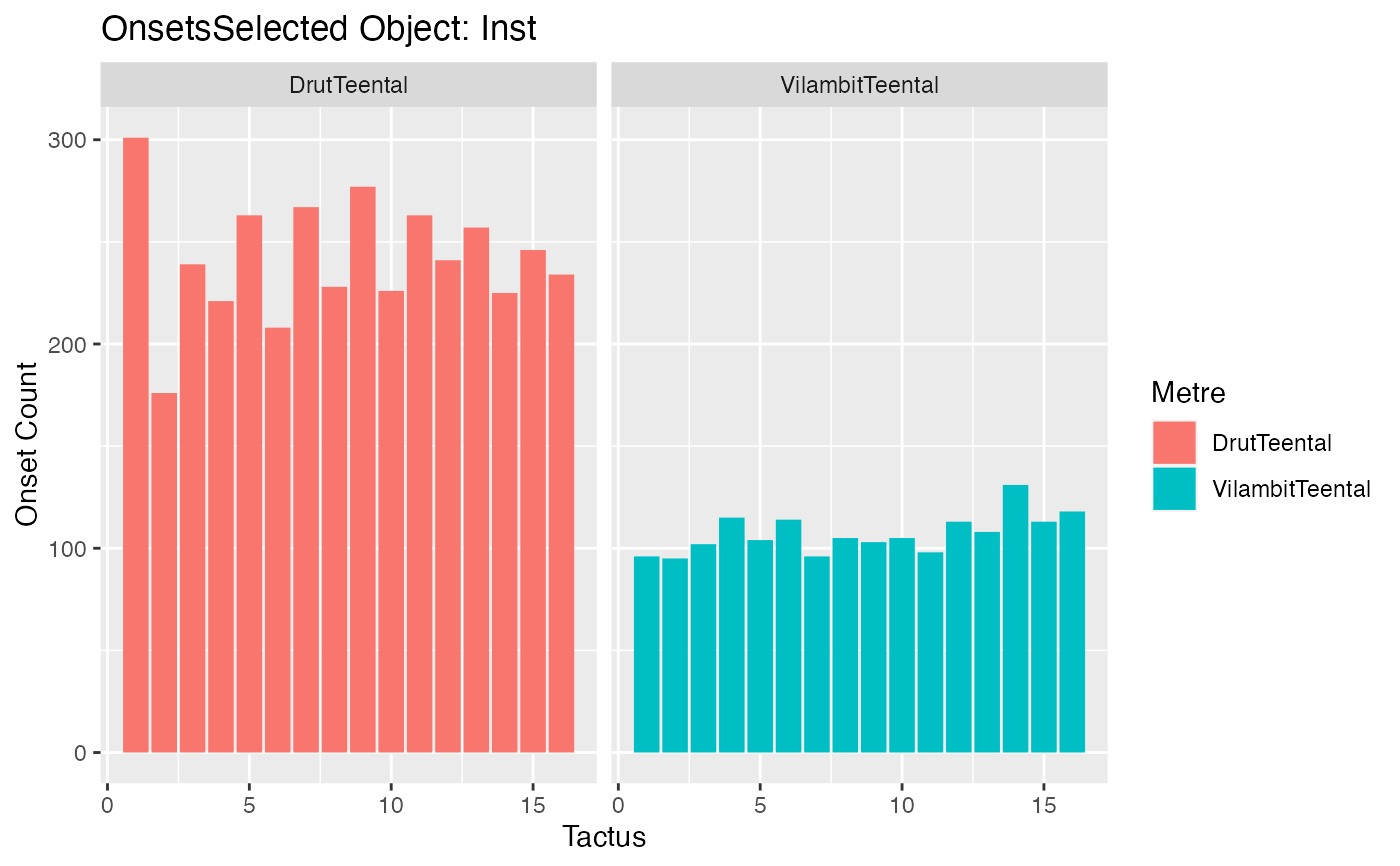
 o <- get_onsets_selected_data(r)
autoplot(o)
#> Warning: Removed 2 rows containing non-finite values (`stat_count()`).
o <- get_onsets_selected_data(r)
autoplot(o)
#> Warning: Removed 2 rows containing non-finite values (`stat_count()`).
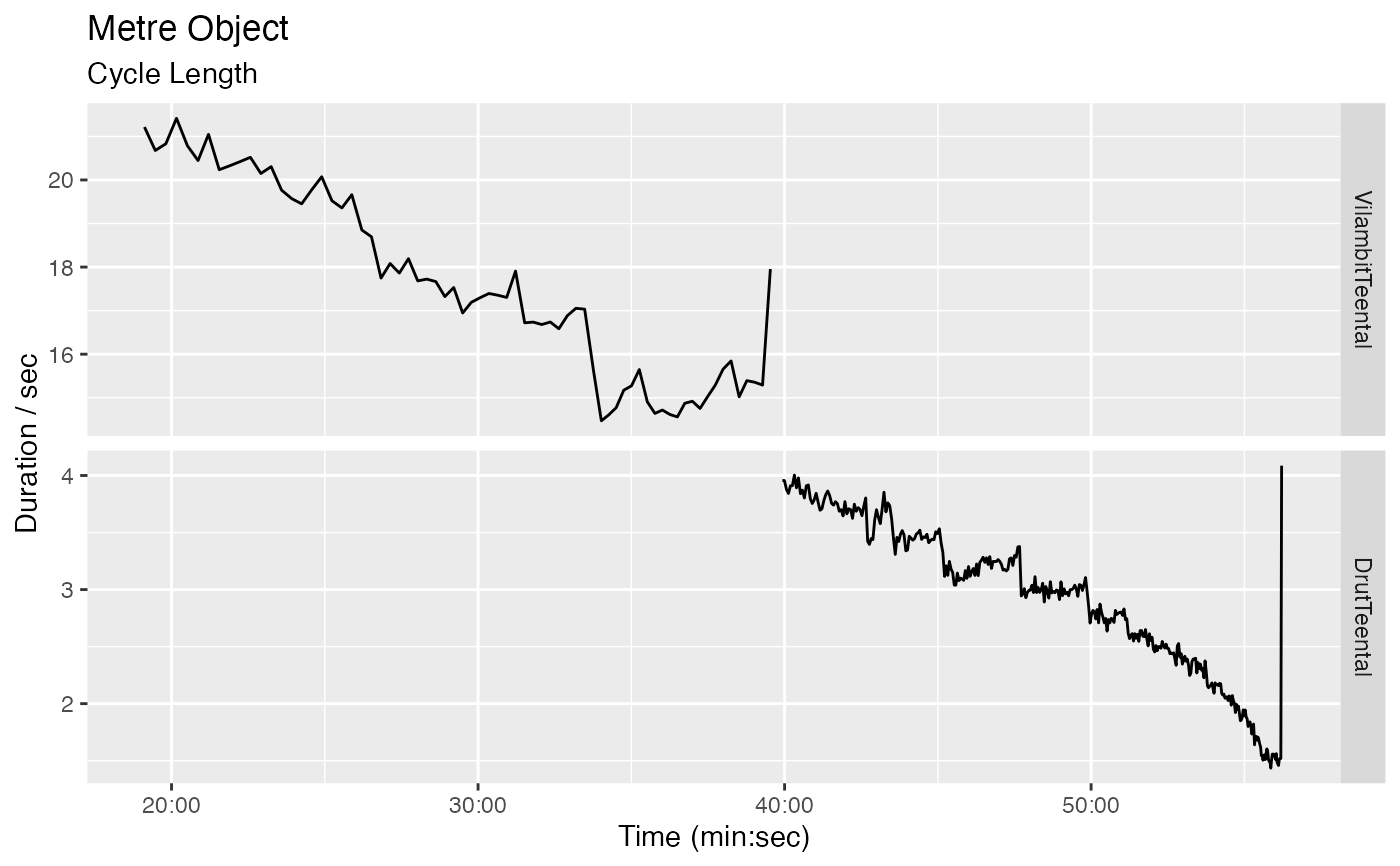
 m <- get_metre_data(r)
autoplot(m)
#> Warning: Removed 1 row containing missing values (`geom_line()`).
m <- get_metre_data(r)
autoplot(m)
#> Warning: Removed 1 row containing missing values (`geom_line()`).
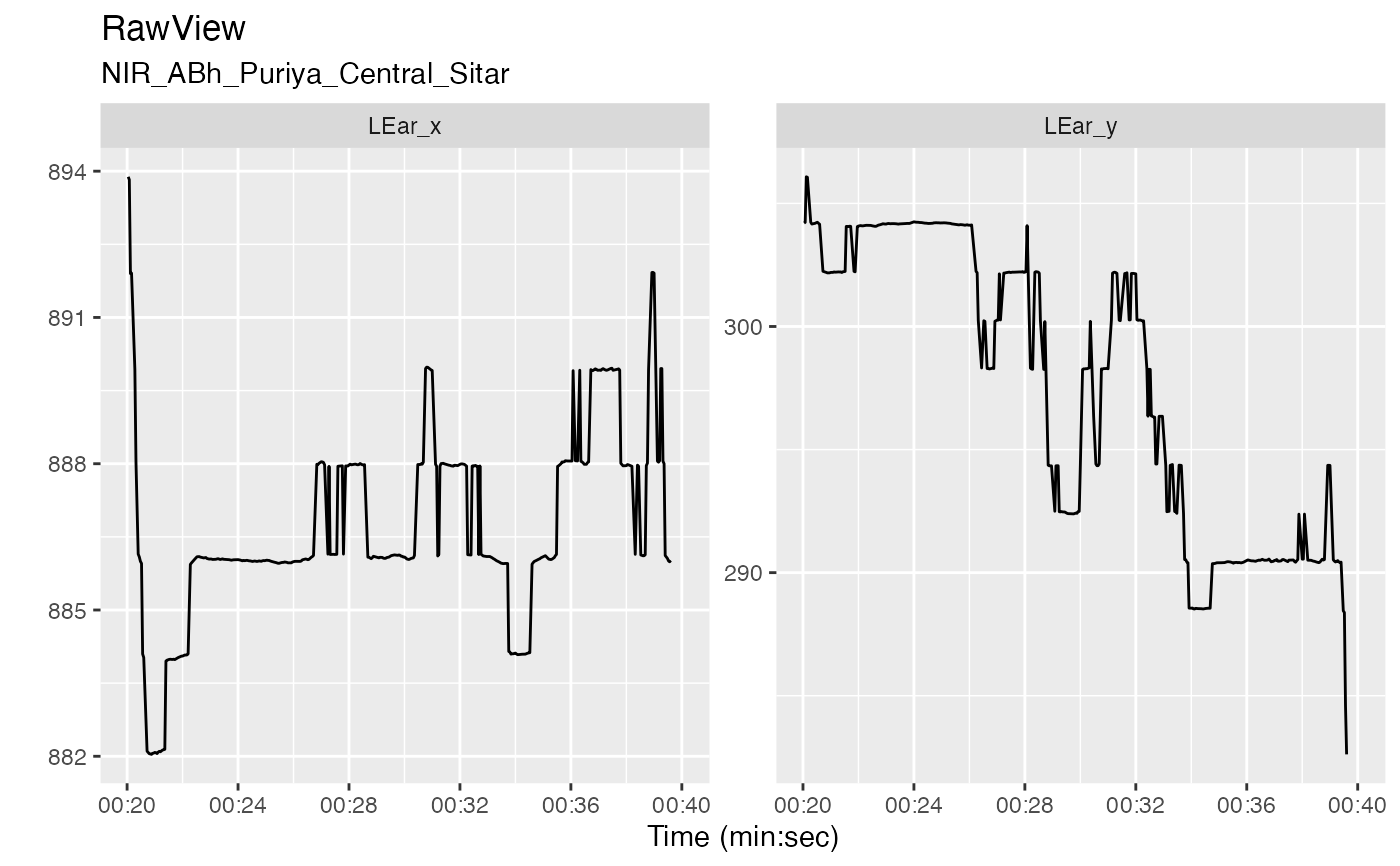
 v <- get_raw_view(r, "Central", "", "Sitar")
autoplot(v, columns = c("LEar_x", "LEar_y"), time_limits = c(20, 40))
#> Warning: Sampling rows for plotting
#> Warning: Removed 7 rows containing missing values (`geom_line()`).
v <- get_raw_view(r, "Central", "", "Sitar")
autoplot(v, columns = c("LEar_x", "LEar_y"), time_limits = c(20, 40))
#> Warning: Sampling rows for plotting
#> Warning: Removed 7 rows containing missing values (`geom_line()`).
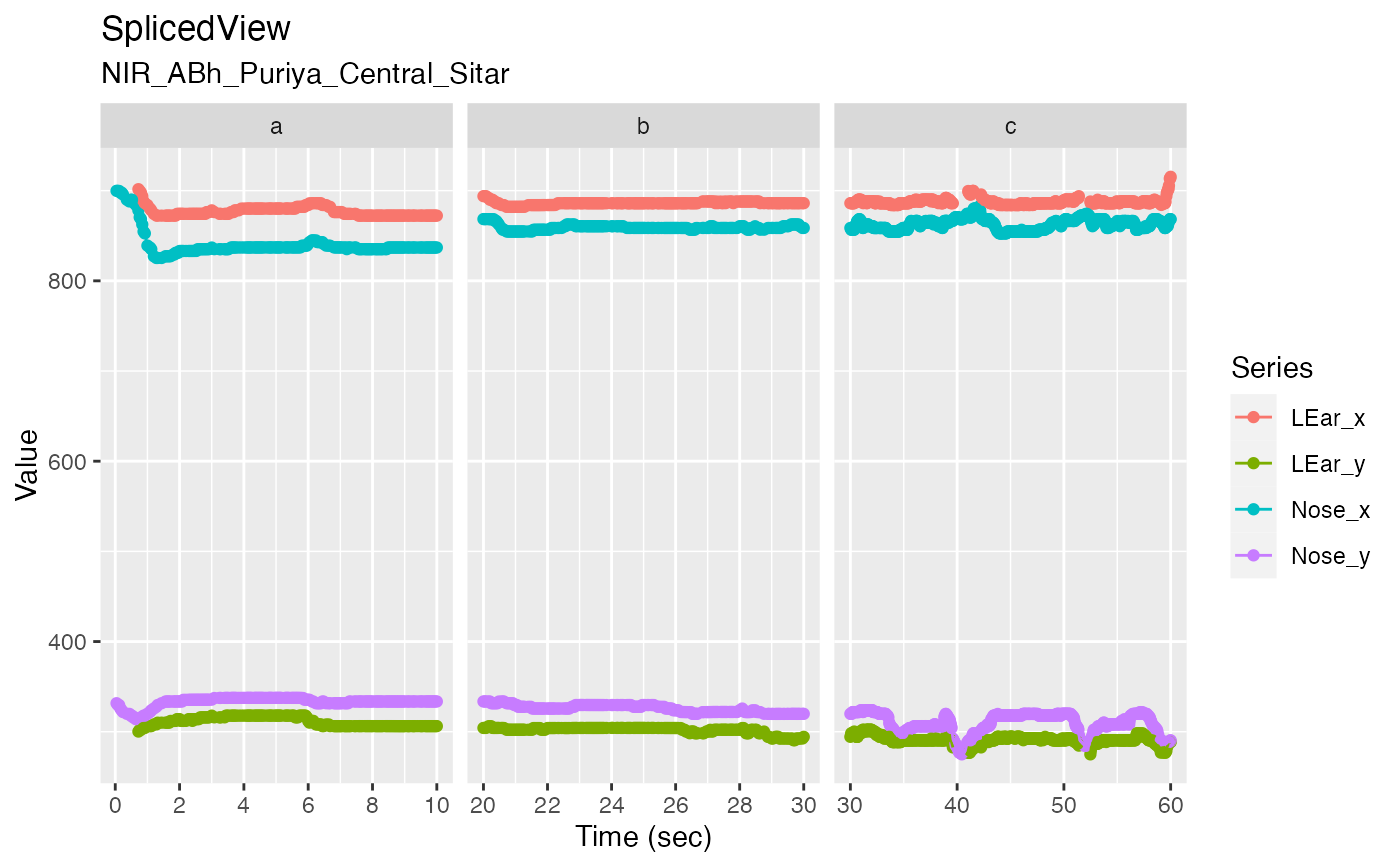
 l <- list(a = c(0, 10), b = c(20, 30), c = c(30, 60))
splicing_df <- splice_time(l)
sv <- get_spliced_view(v, splicing_df)
autoplot(sv, columns = c("LEar_x", "LEar_y", "Nose_x", "Nose_y"), time_breaks = 4, maxpts = 1000)
#> Warning: Sampling rows for plotting
#> Warning: Removed 158 rows containing missing values (`geom_point()`).
#> Warning: Removed 28 rows containing missing values (`geom_line()`).
l <- list(a = c(0, 10), b = c(20, 30), c = c(30, 60))
splicing_df <- splice_time(l)
sv <- get_spliced_view(v, splicing_df)
autoplot(sv, columns = c("LEar_x", "LEar_y", "Nose_x", "Nose_y"), time_breaks = 4, maxpts = 1000)
#> Warning: Sampling rows for plotting
#> Warning: Removed 158 rows containing missing values (`geom_point()`).
#> Warning: Removed 28 rows containing missing values (`geom_line()`).