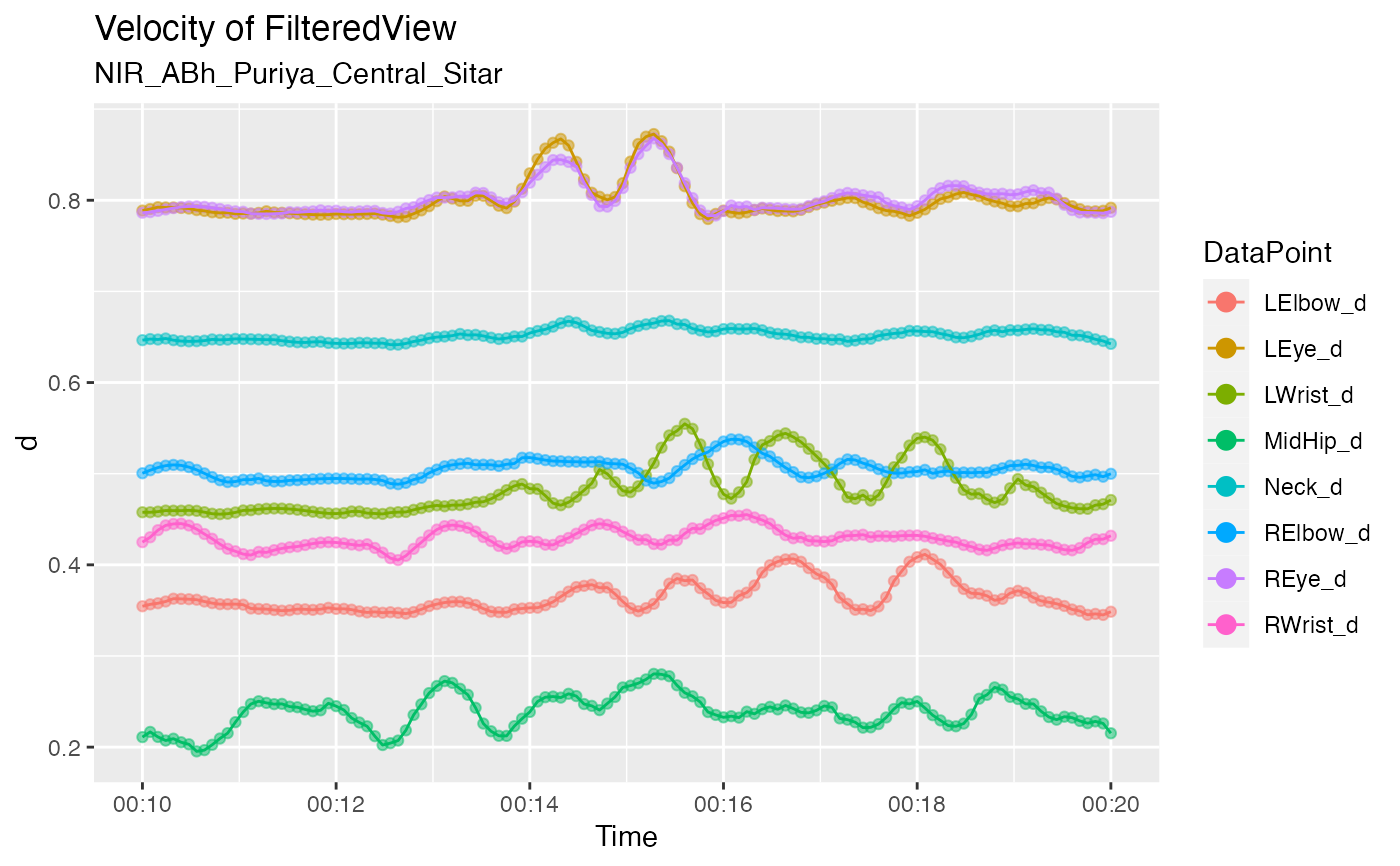
Velocity plot of a view object
velocity_dp.RdVelocity plot of a view object
Arguments
- obj
View object.
- add_mean
add the mean to each line? (default is TRUE).
- vscale
a vertical scaling to apply to the plot (default is 5).
- maxpts
maximum number of points to plot.
- alpha
ggplot aesthetic value.
- ...
passed to
ggplot2::geom_point(),
Examples
r1 <- get_sample_recording()
rv1 <- get_raw_view(r1, "Central", "", "Sitar")
pv1 <- get_processed_view(rv1)
dp <- c("LWrist", "RWrist", "LElbow", "RElbow", "LEye", "REye", "Neck", "MidHip")
fv1 <- apply_filter_sgolay(pv1, data_point = dp, n = 41, p = 4)
sub_fv1 <- subset(fv1, Time >= 10 & Time <= 20, by = 2)
velocity_dp(sub_fv1)
#>  LWrist_y  RWrist_y  LElbow_y  RElbow_y    LEye_y    REye_y    Neck_y  MidHip_y
#> 0.4572584 0.4127374 0.3469293 0.4924832 0.7846029 0.7860753 0.6432571 0.1841962