Specgram Plot
specgram_plot.RdSpecgram Plot
Arguments
- obj
Viewobject.- ...
passed to
signal::specgram().
Examples
# \donttest{
r <- get_recording("NIR_ABh_Puriya", fps = 25)
rv <- get_raw_view(r, "Central", "", "Sitar")
pv <- get_processed_view(rv)
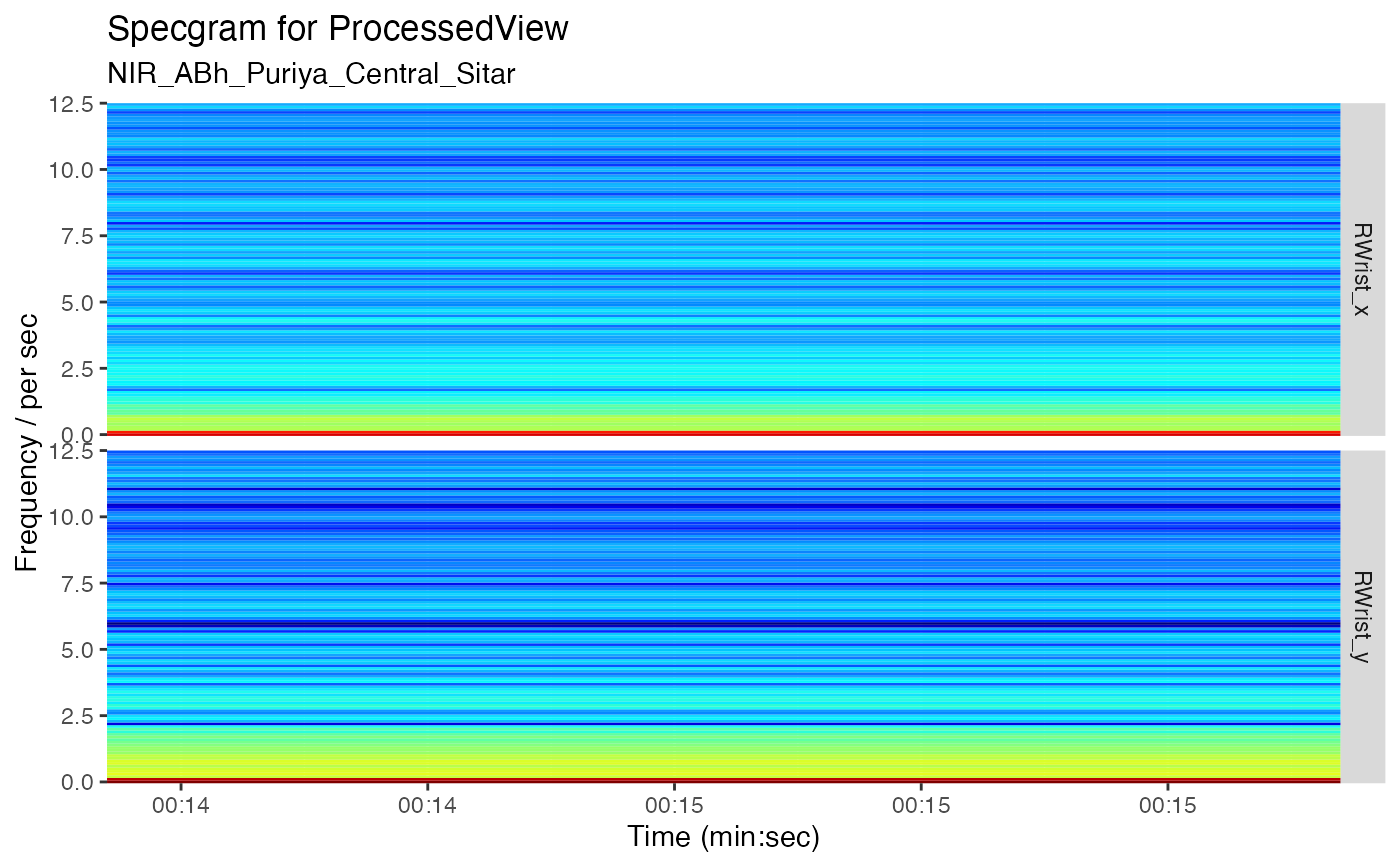
sub_pv <- subset(pv, Time >= 15 & Time <= 25, columns = c("RWrist_x", "RWrist_y"))
specgram_plot(sub_pv)

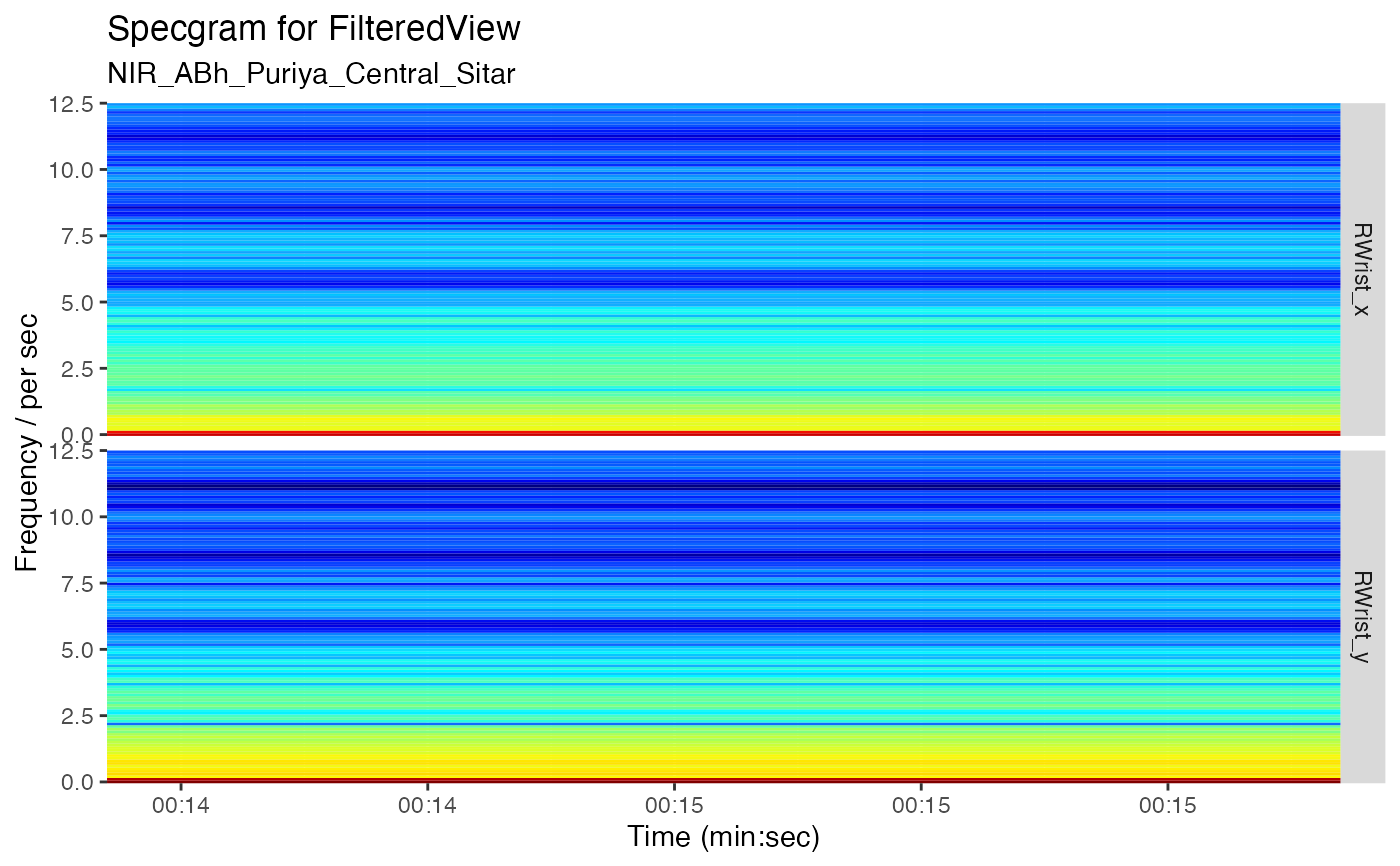
fv <- apply_filter_sgolay(pv, data_points = c("RWrist"), n = 11, p = 4)
sub_fv <- subset(fv, Time >= 15 & Time <= 25, columns = c("RWrist_x", "RWrist_y"))
specgram_plot(sub_fv)

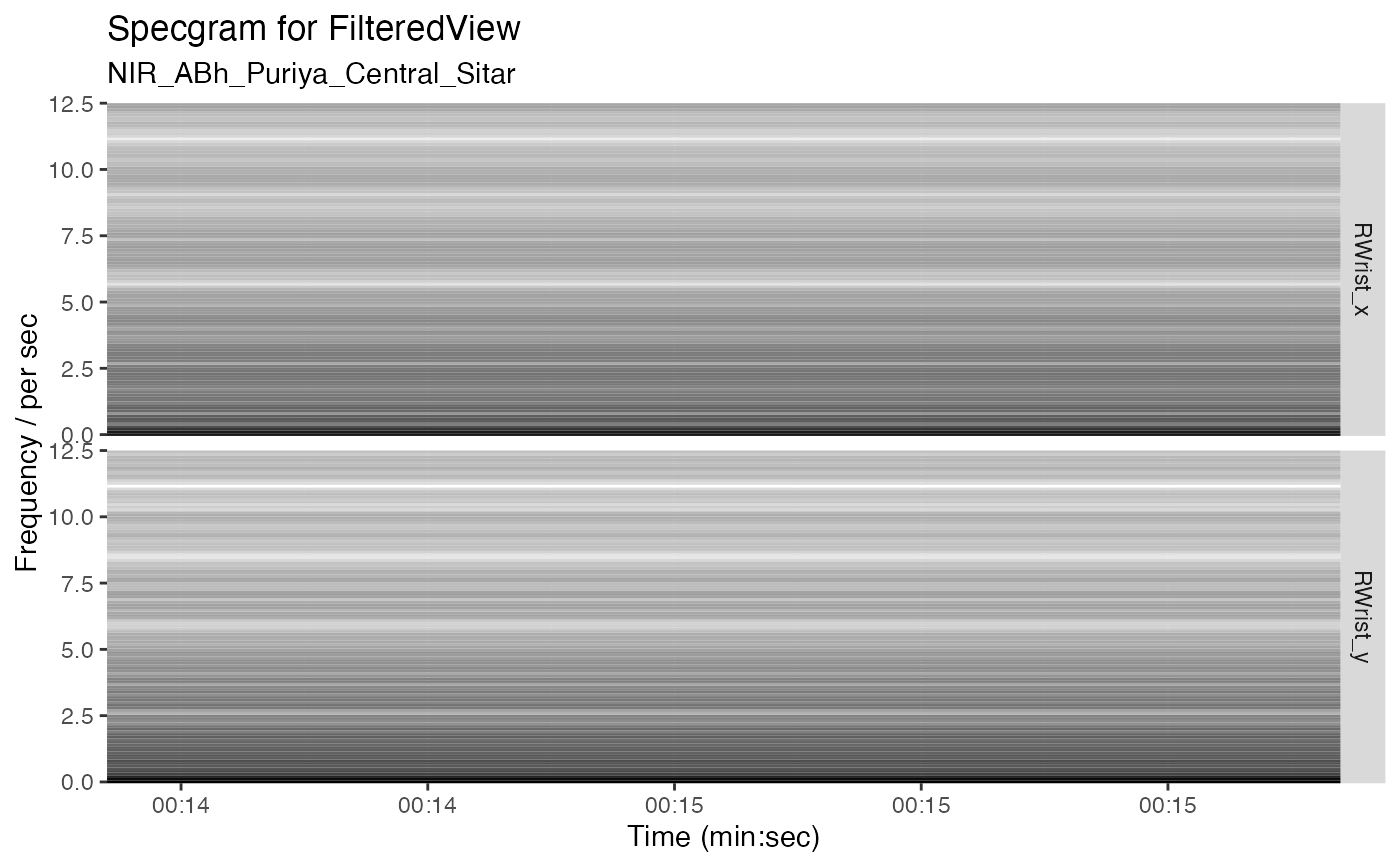
specgram_plot(sub_fv, window = 200) + ggplot2::scale_fill_gradient(low = "white", high = "black")
#> Scale for fill is already present.
#> Adding another scale for fill, which will replace the existing scale.

# }
# }